Key Takeaways
- A sudden spike in profit-taking has put the cryptocurrency market at a pivotal point.
- For Terra (LUNA), Cosmos (ATOM), and Fantom (FTM), it may even mean a retreat into bearish territory.
- Further selling pressure may be likely as these altcoins hold on weak support.
Share this article
Nearly $900 million worth of long and short positions were liquidated across the cryptocurrency market in the past 24 hours. Although the sudden correction significantly impacted Bitcoin and Ethereum, a few altcoins suffered the most. Terra (LUNA), Cosmos (ATOM), and Fantom (FTM) rank among the most affected with further downside potential.
LUNA Stages a Fakeout
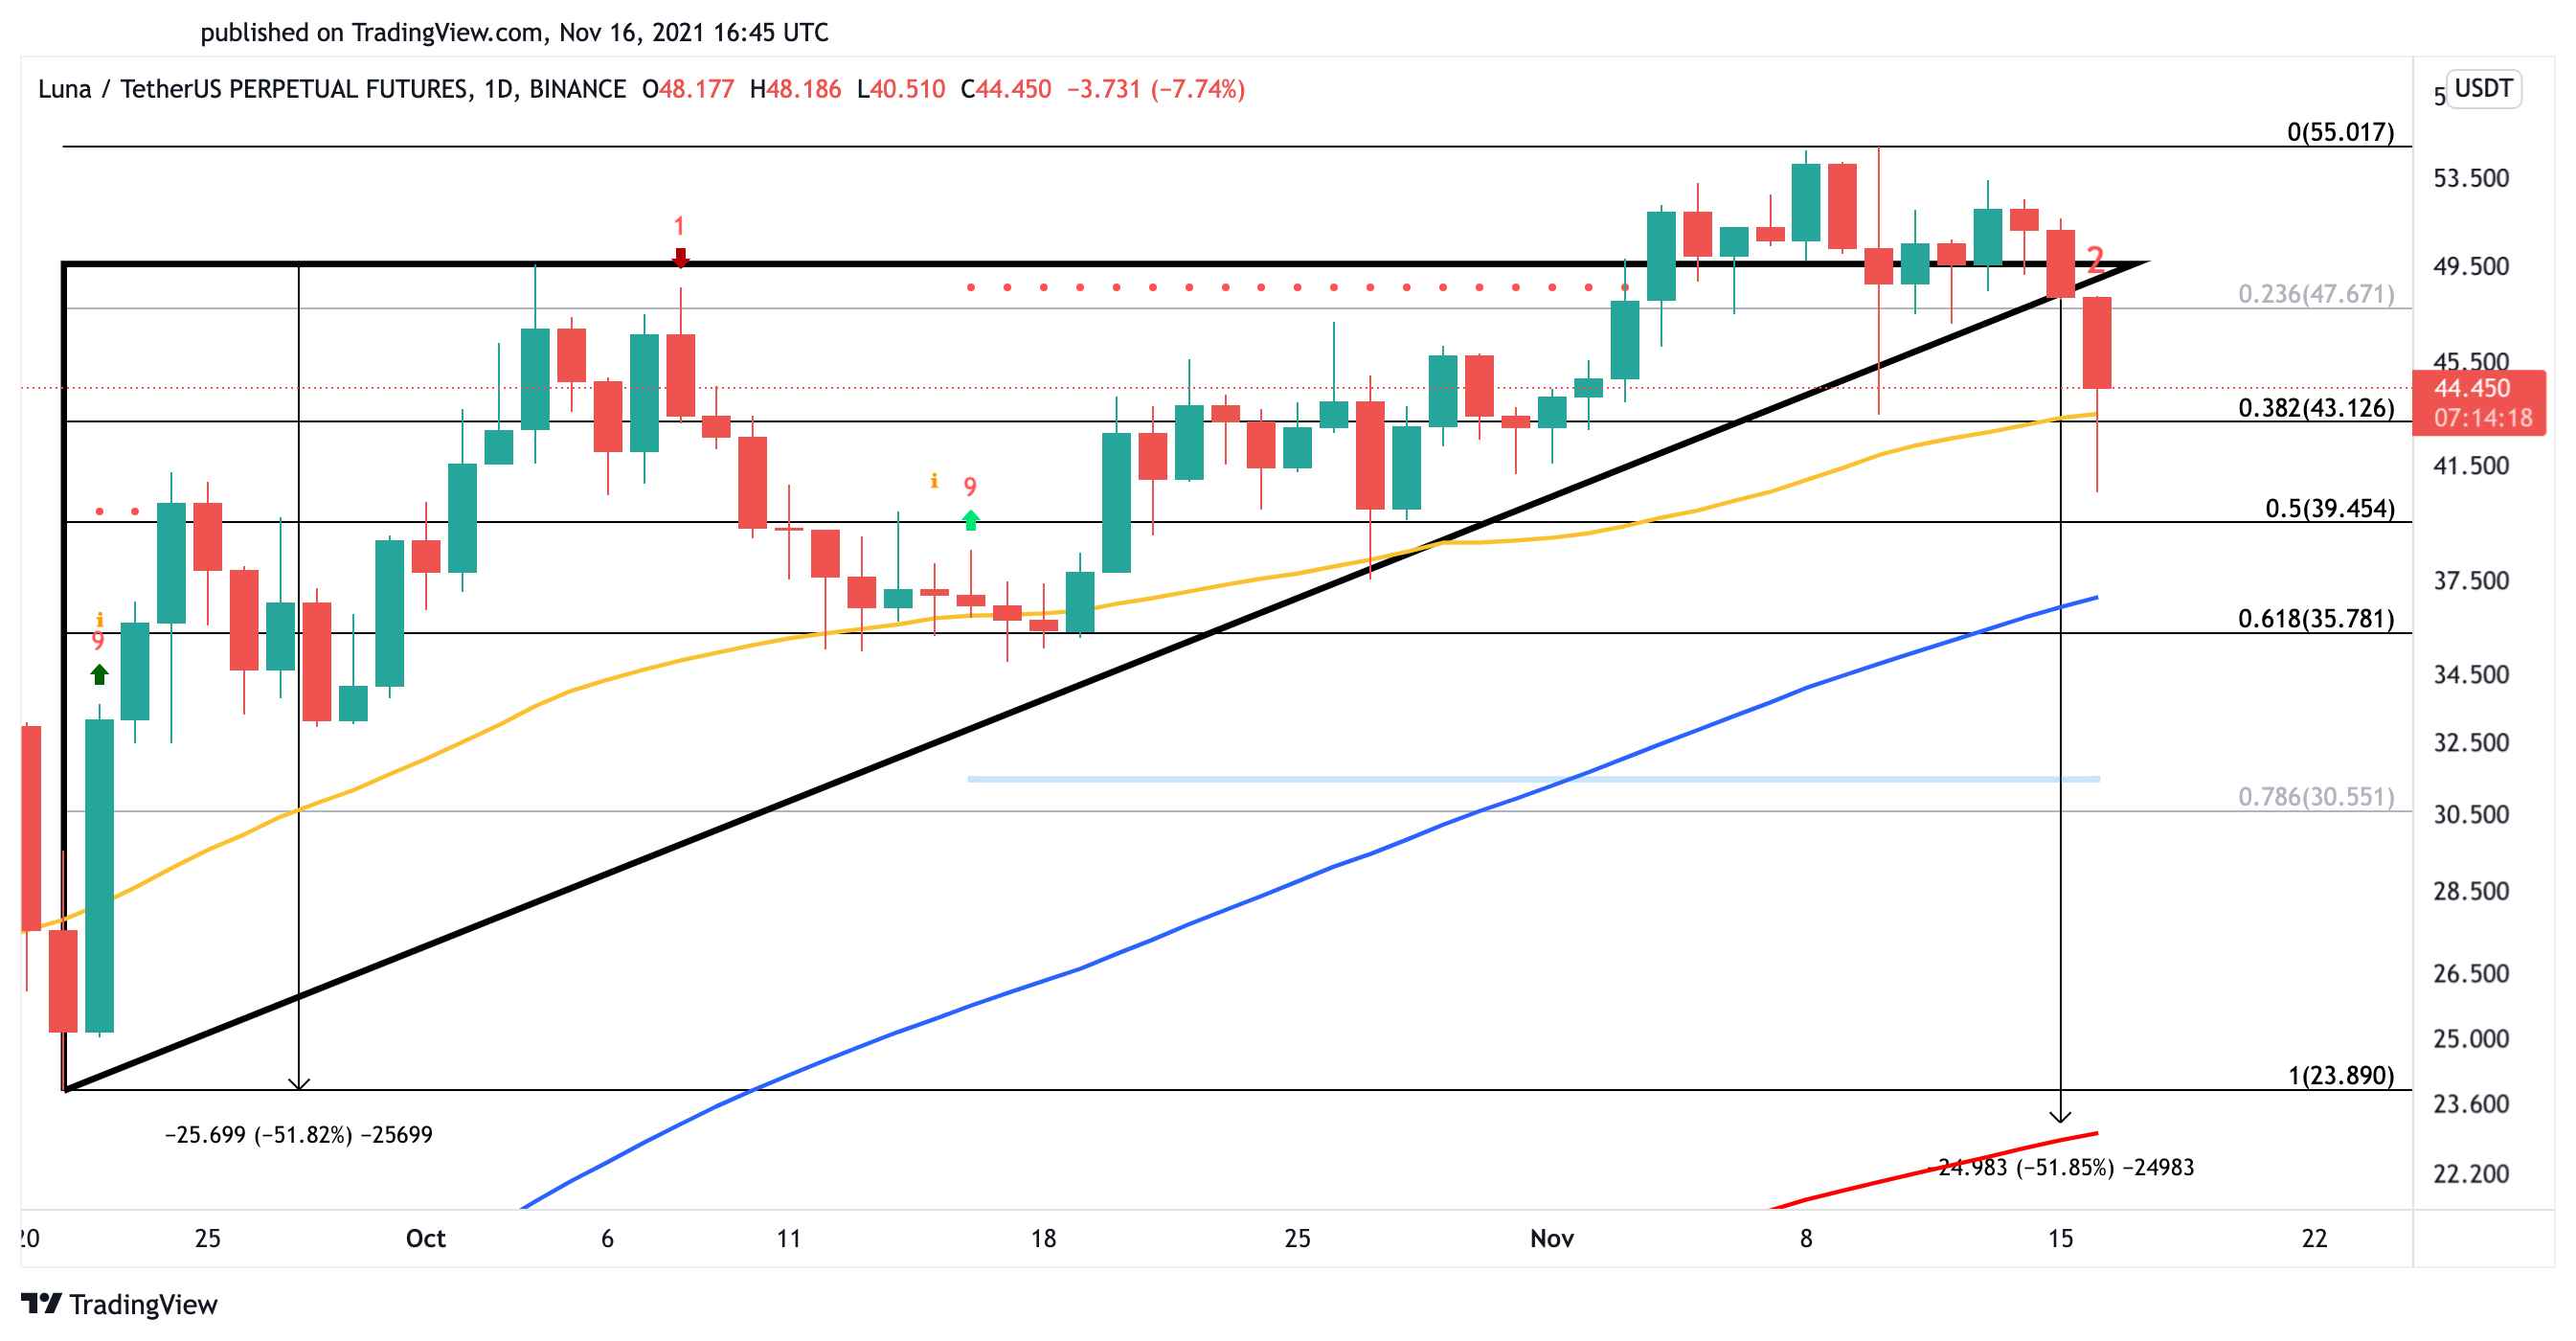
LUNA underwent a nearly two-month-long consolidation period that developed a symmetrical triangle on its daily chart. But on Nov. 4, LUNA broke out of it, signaling that it was bound for a bullish impulse. The upward price action was fueled by news that Grayscale was exploring adding this altcoin to its range of investment products.
Although the consolidation pattern suggested that LUNA was heading to a new all-time high of $75, prices failed to overcome the $55 psychological resistance barrier.
The rejection resulted in a significant spike in profit-taking that now appears to have invalidated the optimistic thesis. Terra has dropped below the $48 support level and appears to be losing the 50-day moving average at $43 as support.
Further selling pressure could be catastrophic for the bulls as it may result in a 52% correction towards the 200-day moving average at $23.

LUNA must rebound from the current price levels and regain $48 as support to avoid such a pessimistic outlook. Only a daily candlestick close above this hurdle would signal the continuation of the uptrend towards $75.
ATOM Breaks Below Support
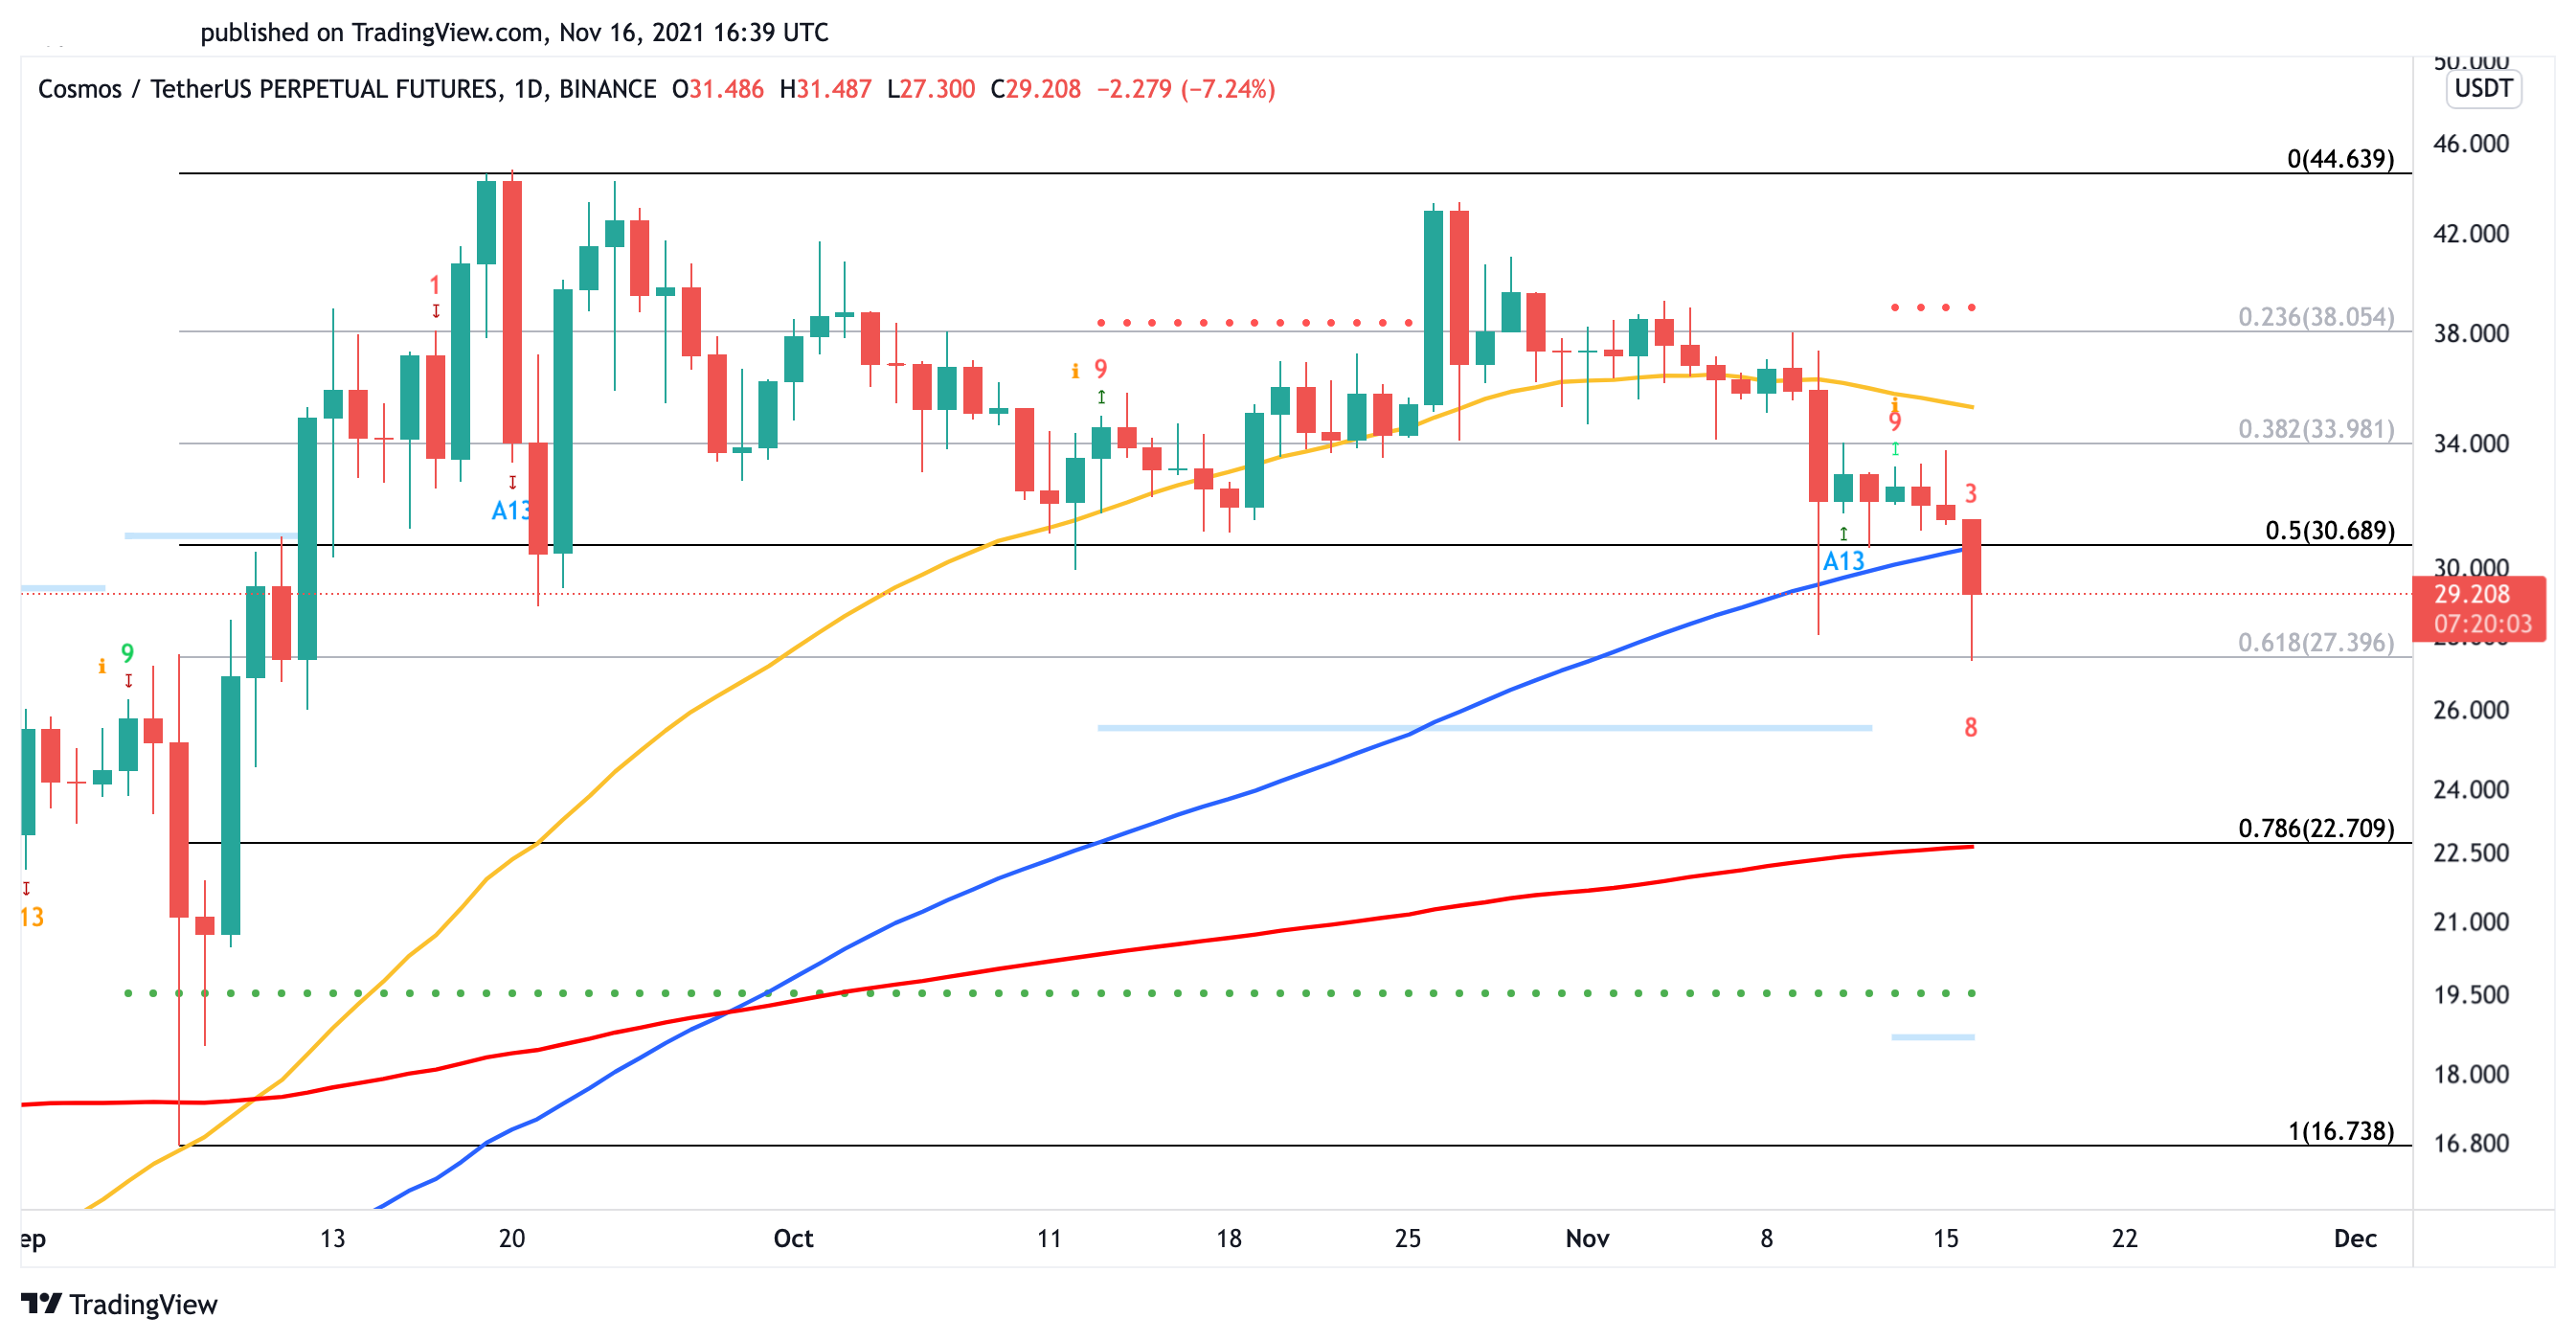
ATOM also continues to trend lower, losing all significant support levels underneath it.
The smart contracts token breached the 50-day moving average on Nov. 10 and breached the 100-day moving average recently. As sell orders continue to pile up, ATOM would likely print a daily candlestick close below $31. Such market behavior would serve as confirmation for lower prices on the horizon.
If this were to happen, nothing would prevent ATOM from dropping towards the 200-day moving average at $23.

While the odds appear to favor the bears, regaining $31 as support could slow down ATOM’s downtrend. More importantly, ATOM would need to close above the 50-day moving average at $35 to restest the all-time high at nearly $45.
Fantom Breaks Down
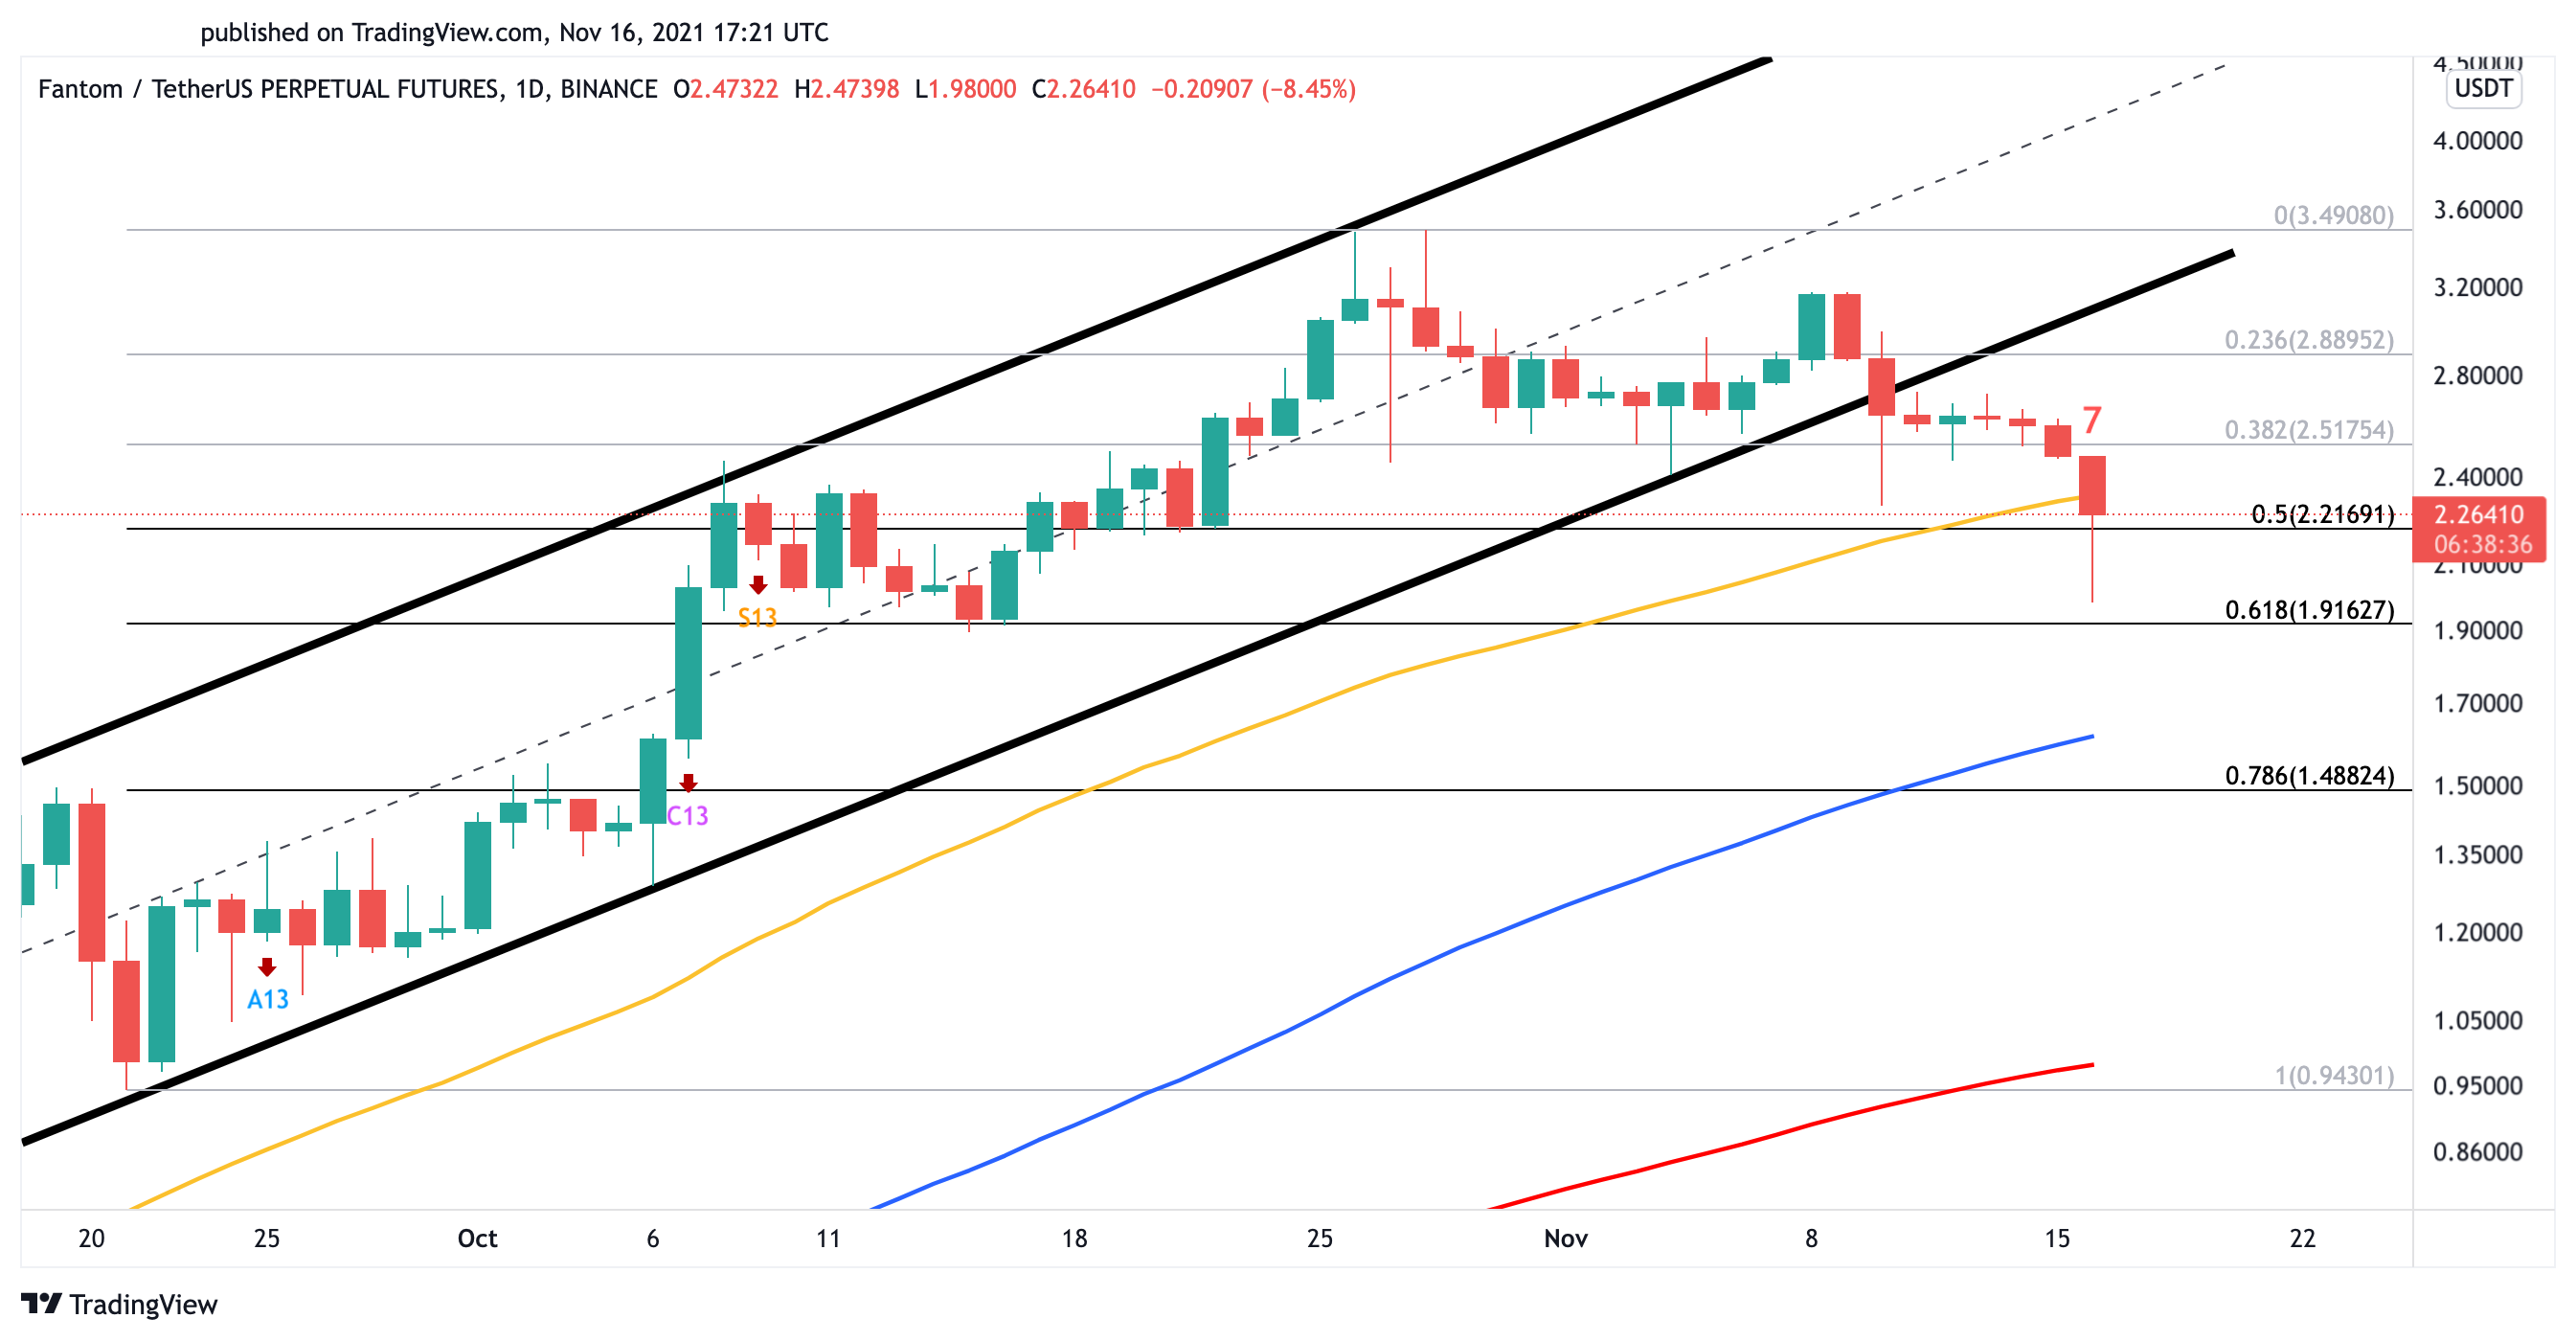
Fantom appears to have another leg down after breaking through a consolidation pattern that had been containing its price since Sep. 13.
The Proof-of-Stake chain’s FTM token breached a significant support barrier represented by the lower boundary of a parallel channel. Slicing through such a strong foothold projected a 40% correction towards the 100-day moving average at $1.62. Fantom has retraced by more than 27% so far and appears to be on track to meet the bearish target.

A daily candlestick close below the 50-day moving average at $2.3 will validate the pessimistic outlook. But if Fantom manages to stay above this support level, it may rebound before meeting the downside target.
Disclosure: At the time of writing, the author of this feature owned BTC and ETH.
Share this article
Fantom Could Rebound to New All-Time Highs
Fantom still looks bullish despite the heightened volatility in the cryptocurrency markets. The Layer 1 blockchain’s FTM token has rebounded from crucial support with little to no resistance ahead. Fantom…
A Beginner’s Guide to Terra’s DeFi Ecosystem
Terra is a Layer 1 blockchain protocol that aims to create a thriving payments-focused financial ecosystem offering interoperability with the real-world economy. Its two key ecosystem components are the so-called…


Leave a Reply