Key Takeaways
- Bitcoin and Ethereum have lost more than 50% in market value since late November.
- Multiple on-chain metrics show that both assets have reached a strong foothold.
- Still, buy orders must increase rapidly to allow BTC and ETH to rebound.
Share this article
Bitcoin and Ethereum appear to have reached a critical support level following a major market correction. Although the downtrend may not be over, there are reasons to believe that a relief rally is underway.
Bitcoin Readies to Rebound
Bitcoin looks primed to bounce off support after incurring significant losses.
The flagship cryptocurrency has been in a downtrend for the last three months, shedding more than 35,000 points in market value. The sell-off has pushed prices below the psychological $40,000 barrier. The asset took a plunge along with the rest of the market from Thursday through Saturday, before dipping further to hit a six-month low of $32,850 today.
Although many demand walls have been broken on the way down, BTC appears to have found stable support.
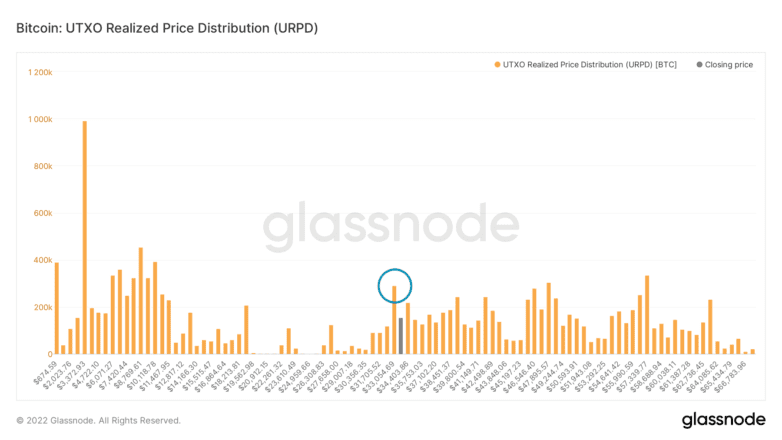
Glassnode’s UTXO Realized Price Distribution (URPD) model shows that a large concentration of BTC tokens was last moved around $33,000. Such market behavior makes this price point one of the most significant support zones underneath the number one crypto.
If it continues to hold, Bitcoin could have a chance of rebounding.

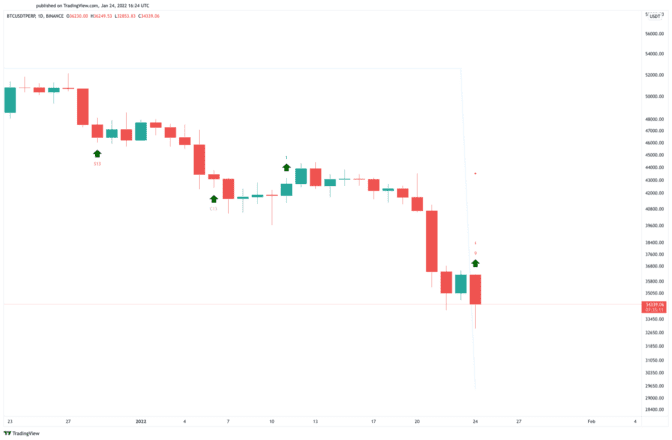
The Tom DeMark (TD) Sequential indicator adds credence to the optimistic outlook. It currently presents a buy signal on Bitcoin’s daily chart. The bullish formation developed as a red nine candlestick, which is indicative of a one to four daily candlesticks upswing.
A spike in buying pressure could help push BTC toward $40,000 or even $43,000.

It is worth noting that the URPD model also shows little to no support below $33,000. Breaching the critical area of demand could create a capitulation event that results in further losses. Under such circumstances, Bitcoin could crash to $19,500—a key historical level not seen since December 2020.
Ethereum Finds Stable Support
Ethereum appears to be forming a local bottom while the Crypto Fear & Greed Index shows that market participants are displaying signs of fear.
More than $640 million worth of long ETH positions have been liquidated across the board over the past week. As ETH plummeted 32%, overleveraged traders were among the hardest hit. Now, ETH appears to have found a strong foothold.
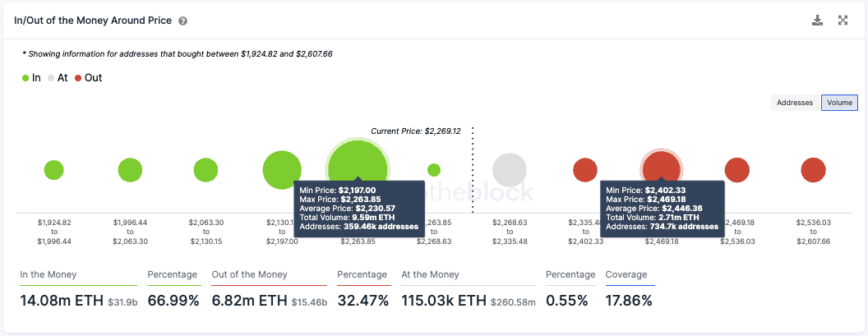
IntoTheBlock’s In/Out of the Money Around Price (IOMAP) model shows that nearly 360,000 addresses have purchased 9.6 million ETH around $2,200. This has created a significant demand wall that could prevent prices from dipping further and serve as a rebound zone.

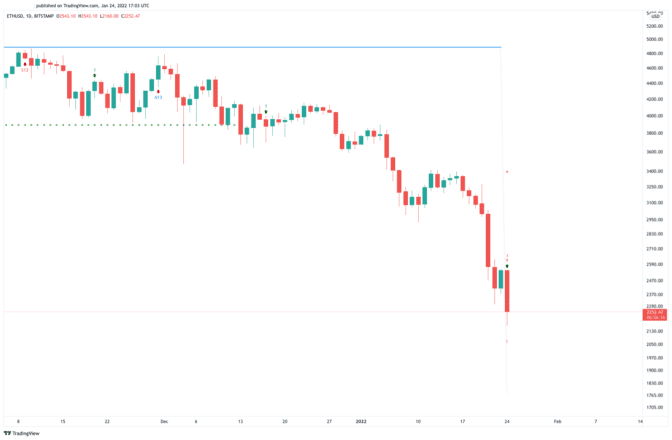
The TD Sequential supports the bullish thesis as it currently presents a buy signal on Ethereum’s daily chart. The formation of a red nine candlestick is indicative of a one to four daily candlesticks upswing or the beginning of a new upwards countdown.
To validate the optimistic outlook, ETH would have to overcome the $2,500 resistance level to approach $3,000.

The $2,200 support level is a major one for ETH. Any signs of weakness could discourage investors from re-entering the market. In turn, this could result in a downswing to the next key level at $1,700—a level that ETH last saw as a local bottom in July 2021.
Disclosure: At the time of writing, the author of this piece owned BTC and ETH.
Share this article
Bitcoin, Ethereum Enter Potential Buy Zone
Bitcoin and Ethereum appear bound for high volatility as several on-chain metrics suggest that a market bottom is near. Still, these cryptocurrencies must overcome a significant obstacle to resume the…

Leave a Reply