

Avalanche (AVAX) risks breaking down from a long-term horizontal support area that has been in place for 938 days.
If this occurs, it could have massive bearish ramifications for the price, potentially causing a 50% drop.
Avalanche Price Risks Breakdown From Long-Term Support
The Avalanche price has fallen under a descending resistance line since reaching an all-time high of $147 in November 2021. The line was most recently touched in March 2022 (red icon).
During the decrease, the price bounced at the $11.50 horizontal support level twice in January and June 2023 (green icons). The second bounce created a long lower wick, considered a sign of buying pressure. The $11.50 area is most important since it has been in place for 938 days.
However, AVAX has failed to initiate any upward movement. To the contrary, the price has fallen and is trading only slightly above the $11.50 support area while being considerably below the descending resistance line, which is currently at $20. This occurred despite the Uniswap V3 deployment on the Avalanche network.
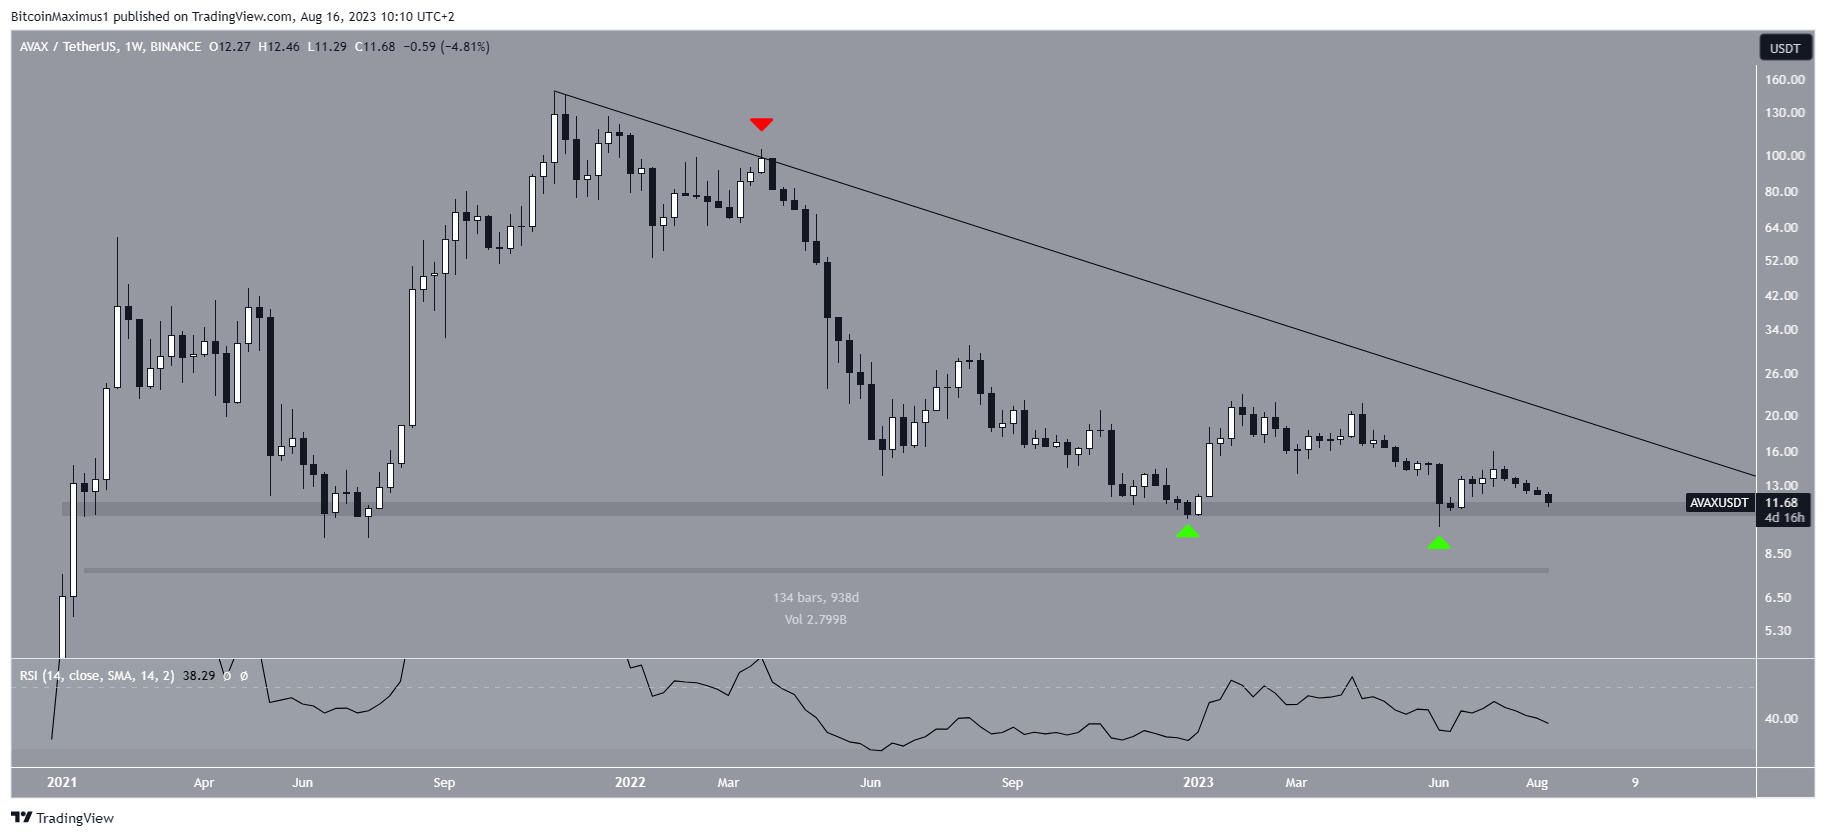
The weekly RSI provides a bearish reading. Market traders use the RSI as a momentum indicator to identify overbought or oversold conditions and to decide whether to accumulate or sell an asset.
Readings above 50 and an upward trend indicate that bulls still have an advantage, whereas readings below 50 suggest the opposite. The indicator is below 50 and falling, both considered signs of a bearish trend.
AVAX Price Prediction: Will Price Struggles Continue?
The daily timeframe technical analysis also provides a bearish reading. The main reason for this is the rejection (red icon) from the $14.50 horizontal area and the ensuing decrease.
Also, the rejection occurred after a breakout from a short-term descending resistance line. The failure to reclaim the $14.50 area after the breakout is another bearish sign. The fact that the price now trades below the breakout level suggests that the breakout was not legitimate.
Finally, the daily RSI is below 50 and decreasing, also a sign of a bearish trend.
As a result, a breakdown from the long-term $11.50 horizontal support area is the most likely future price scenario. If this occurs, a 50% drop to the next support at $6 will likely be the future price outlook.
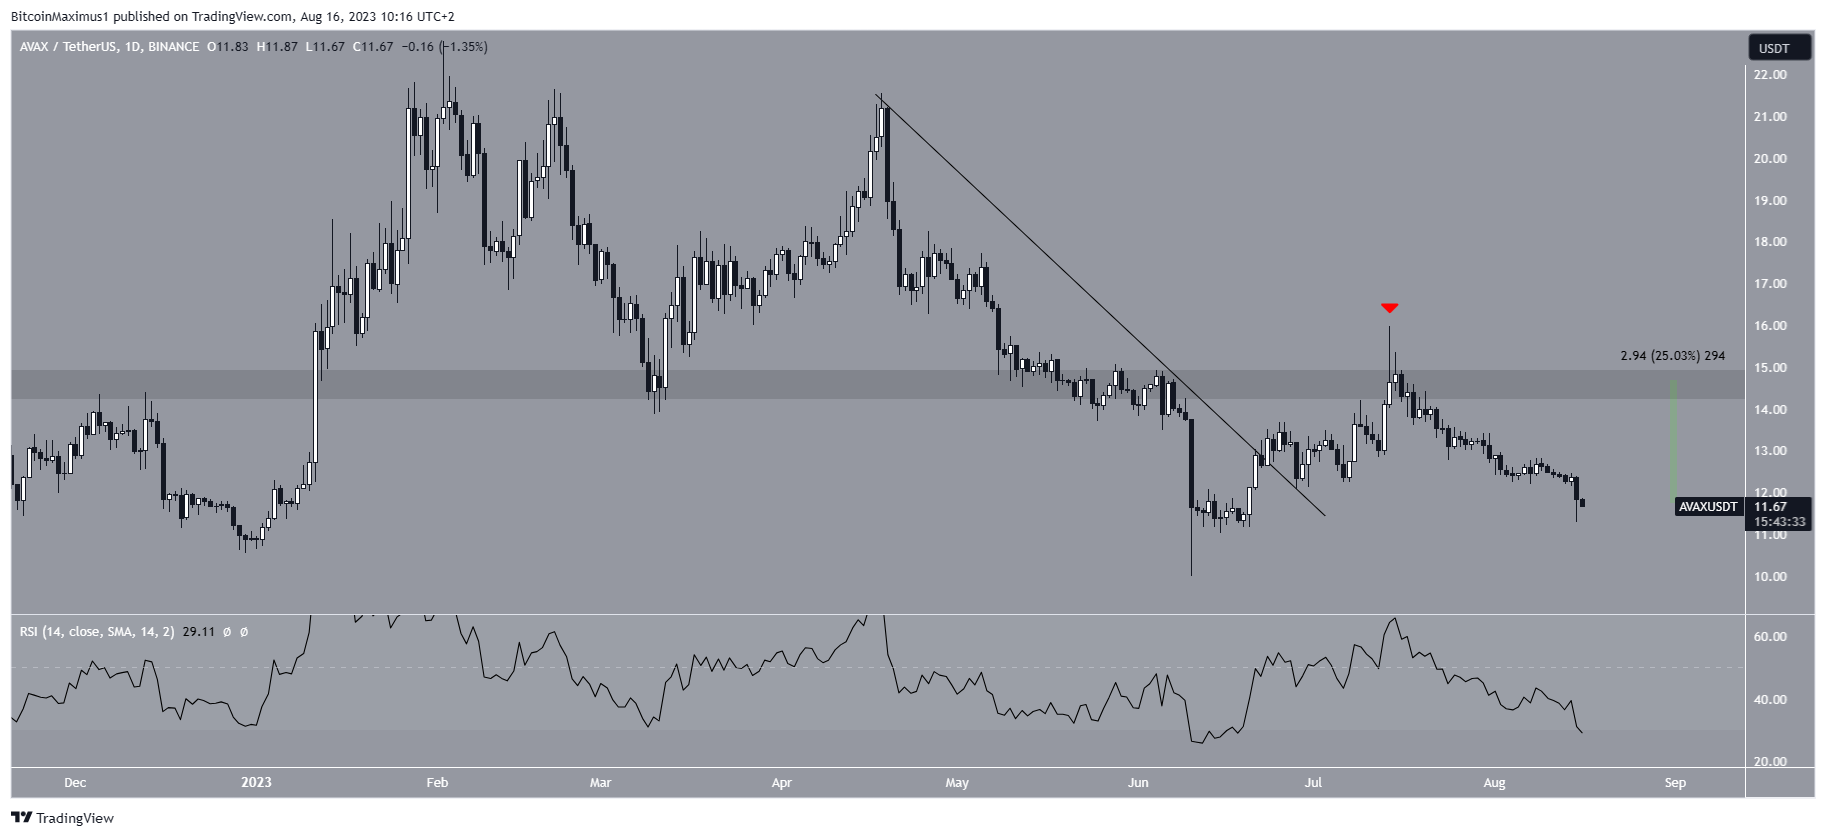
Despite this bearish AVAX price prediction, a strong bounce at the $11.50 horizontal support area could lead to a 25% increase to the next resistance at $14.50.
For BeInCrypto’s latest crypto market analysis, click here.
Disclaimer
In line with the Trust Project guidelines, this price analysis article is for informational purposes only and should not be considered financial or investment advice. BeInCrypto is committed to accurate, unbiased reporting, but market conditions are subject to change without notice. Always conduct your own research and consult with a professional before making any financial decisions.
Leave a Reply