The price of Cardano (ADA) has created a bullish triple-bottom pattern since the beginning of July.
The pattern was created inside the $0.24 horizontal support area, which has existed since the beginning of the year. Will the price react positively to this bullish pattern?
Cardano Creates Bullish Pattern
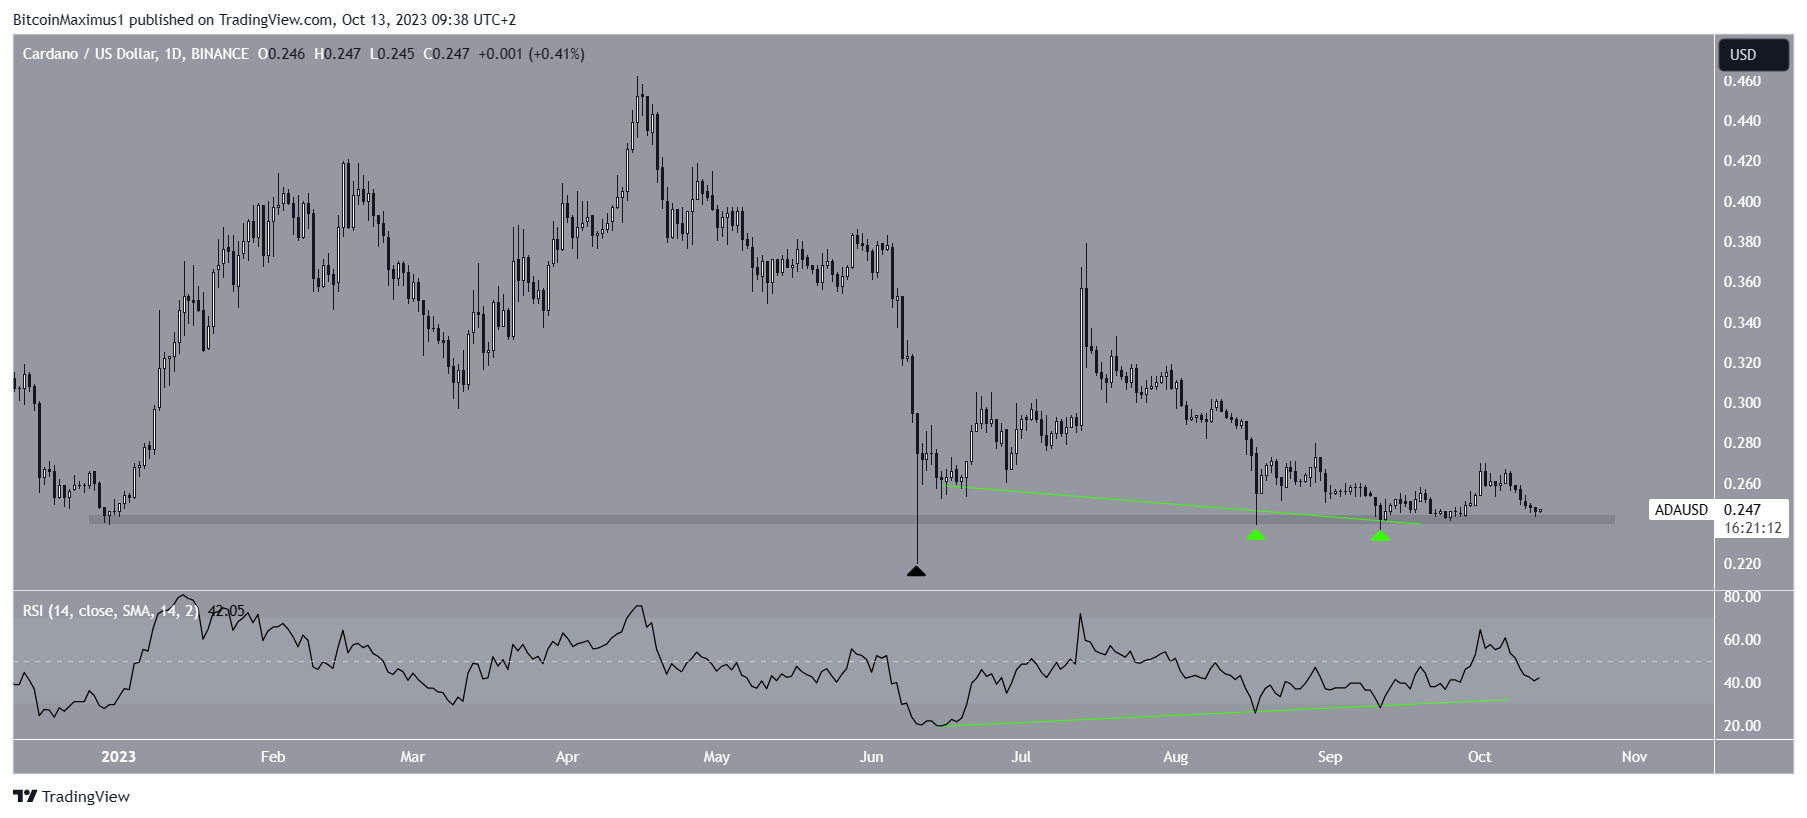
The analysis of the daily chart for ADA reveals that its price has declined since reaching a yearly peak of $0.46 in April. This decline reached a low point of $0.22 on June 10.
Following this drop, the price of Cardano experienced a rebound. It formed a long lower wick (black icon) and confirmed the $0.24 level as a support zone.
Subsequently, ADA revisited the $0.24 support area on two occasions, namely August 17 and September 11 (green icons). This created a triple bottom pattern, which is typically seen as bullish.
Despite this bullish pattern, ADA has yet to make any upward movements.
In the news, Cardano founder Charles Hoskinson has expressed shock at what he believes is unfair media coverage of Sam Bankman-Fried. More specifically, he says, “The Bernie Madoff of my generation is getting a free pass by the media.”
Mr. Hoskinson also introduced a new privacy-focused sidechain called Midnight Protocol. Its three core visions are based on Freedom of Association, Commerce, and Expression, leading to the acronym ACE.

The daily Relative Strength Index (RSI) suggests the trend is bullish.
Traders use the RSI as a momentum indicator to gauge whether a market is overbought or oversold, helping them decide on buying or selling assets.
An RSI reading above 50 during an upward trend indicates an advantage for bulls, while a reading below 50 suggests bears are in charge.
Notably, the RSI has shown significant bullish divergence (green line) during the formation of the triple bottom pattern.
This divergence occurs when an increase in momentum accompanies a decrease in price, often signaling a reversal towards a bullish trend.
ADA Price Prediction: Can Short-Term Breakout Kickstart Reversal?
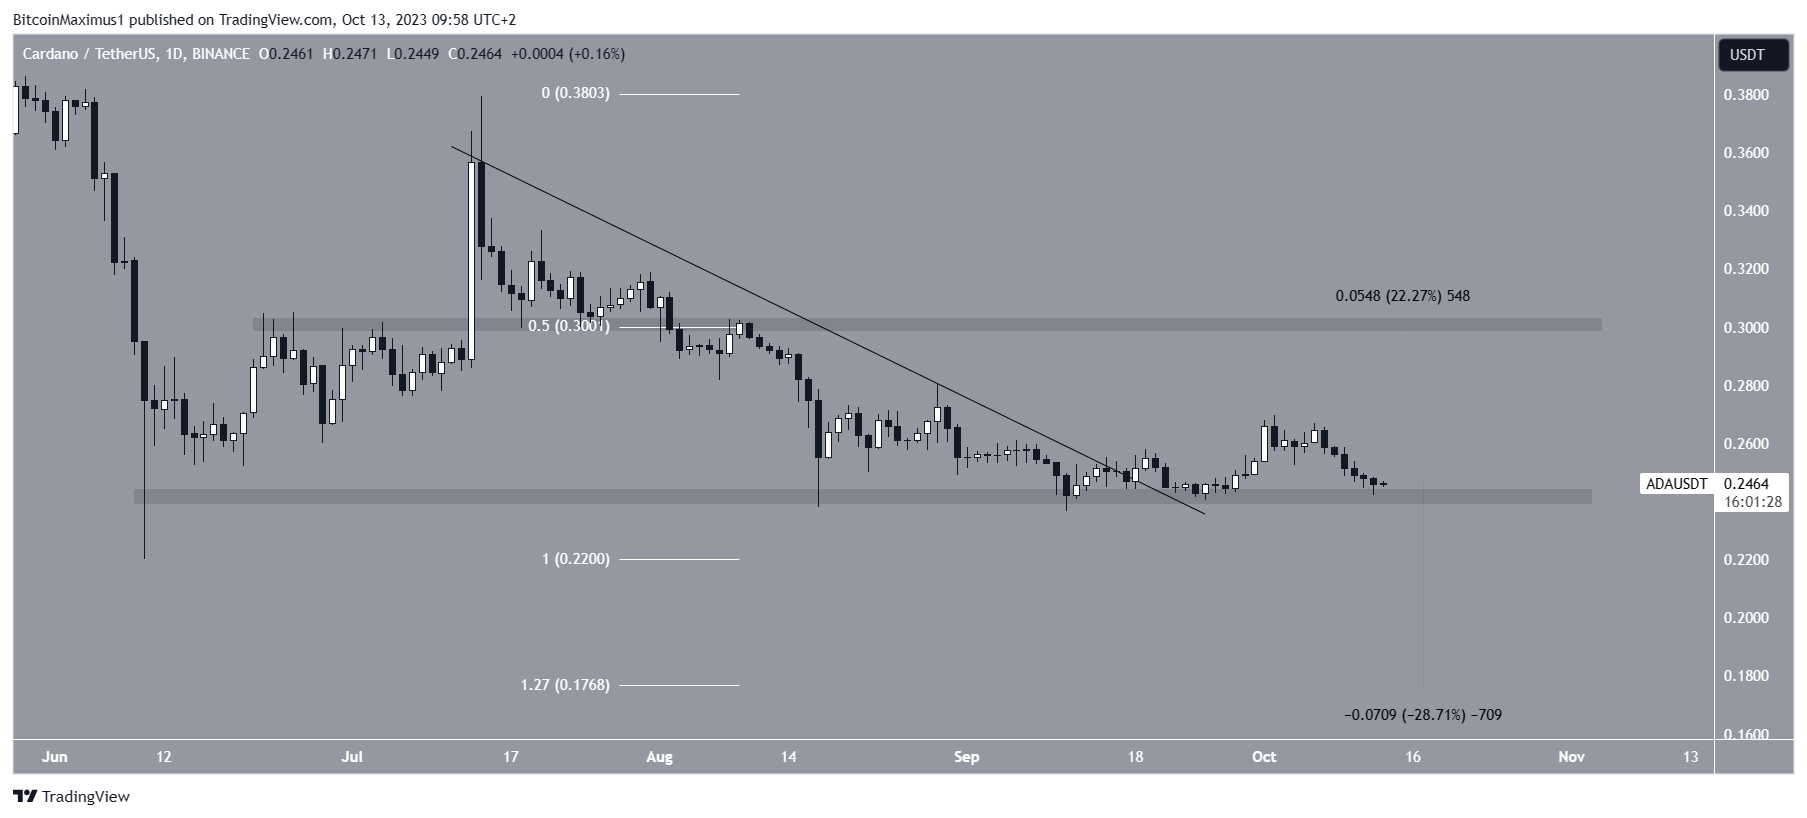
Taking a closer look at the price action, ADA made a breakout from a descending resistance trendline on September 15.
While the altcoin didn’t immediately increase, it picked up its pace at the beginning of October, culminating with a high of $0.27 on October 2.
Therefore, it’s reasonable to anticipate that the most probable future movement for the cryptocurrency is an upward push, aiming for at least the $0.31 resistance zone.
This zone corresponds to both the 0.5 Fibonacci retracement resistance level and a horizontal resistance area. It stands 20% higher than the current price.
A successful reclaim of this area would not only confirm the triple bottom pattern but also validate the overall bullish ADA trend reversal.

However, it’s essential to note that despite this optimistic ADA price projection, if the price falls below the $0.24 horizontal zone, it would negate both the longer-term triple bottom pattern and the short-term bullish outlook.
In such a scenario, a 30% decline to $0.18 becomes a more likely possibility. The bottom is found by using the 1.27 external Fib retracement of the most recent increase.
For BeInCrypto’s latest crypto market analysis, click here.
Disclaimer
In line with the Trust Project guidelines, this price analysis article is for informational purposes only and should not be considered financial or investment advice. BeInCrypto is committed to accurate, unbiased reporting, but market conditions are subject to change without notice. Always conduct your own research and consult with a professional before making any financial decisions.

Leave a Reply