
KAVA, Near Protocol (NEAR), Avalanche (AVAX), Axie Infinity (AXS), and Stellar (XLM) are all altcoins that have interesting developments lined up in January, which could positively affect their price.
December was bullish for the cryptocurrency market, especially for altcoins such as Solana (SOL), Injective (INJ) and ORDI. The five altcoins below could draw even more attention in January 2024.
KAVA Reduces Inflation to 0
- Price: $0.94
- Market Cap: $1,006 billion
- Rank: #69
The KAVA team announced that after the release of KAVA Mainnet 15, the token will have 0 inflation since January 1, leading to a fixed supply of 1 billion tokens. Since no new coins will be minted, the staking rewards will be sourced from the Kava Strategic Vault.
The KAVA price has increased since breaking out from a descending resistance trend line in October. The breakout also caused a movement above the $0.70 horizontal area, leading to a high of $0.95 this week.
The RSI is a momentum indicator traders use to evaluate whether a market is overbought or oversold and whether to accumulate or sell an asset.
Readings above 50 and an upward trend suggest that bulls still have an advantage, while readings below 50 indicate the opposite.
The weekly RSI supports the breakout since it increased above 50 (green icon) when the price broke out.
KAVA now approaches the next resistance at $1. If it closes above it, it can increase by 60% to the next resistance at $1.50.
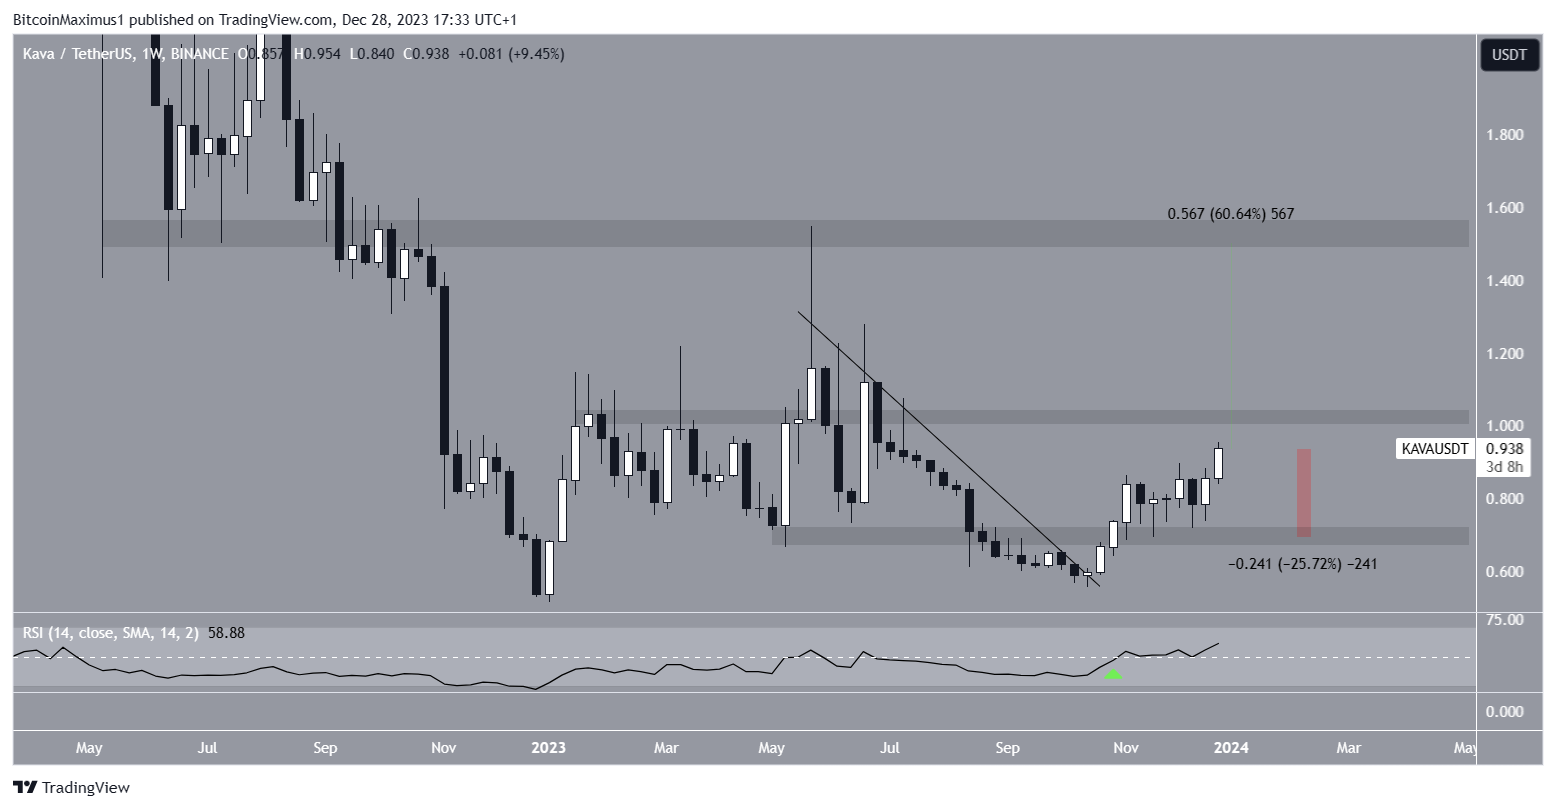
Despite this bullish KAVA price prediction, failure to close above $1 can trigger a 25% decrease to the $0.70 support area.
Avalanche Launches New Wallet
- Price: $40.10
- Market Cap: $14,695 billion
- Rank: #9
The current Avalanche Wallet will be phased out on January 23. This is the result of the transition to the Core Wallet, simplifying the portfolio and staking operations. It is important to note that this will not affect active delegators and validators, and the same seed phrase will work for the Core Wallet.
The AVAX price has experienced a sharp surge since October, starting at a low of $8.65 and culminating with a high of $49.95 on December 24.
During this impressive climb, AVAX broke free from a 750-day descending resistance trend line that had persisted since the all-time high, significantly accelerating its upward trajectory afterward.
Over the past ten weeks, the AVAX price has generated nine bullish weekly candlesticks, underscoring the strength of its bullish momentum.
While AVAX reached a new yearly high of $49 last week, it is creating a bearish engulfing candlestick this one.
Nevertheless, if the upward movement continues, AVAX can increase by 70% to the next resistance at $68.
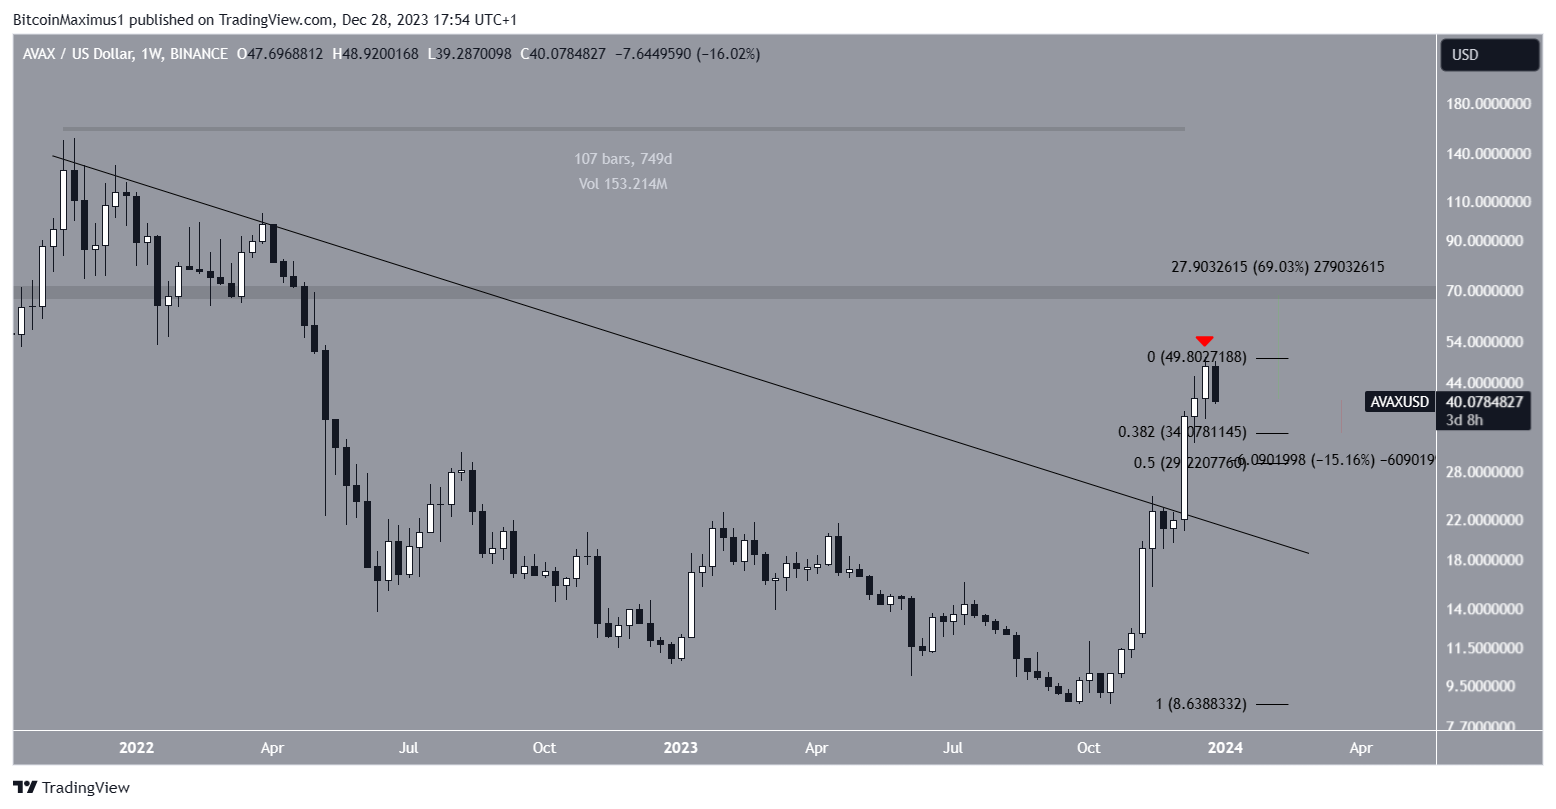
Despite this bullish AVAX price prediction, creating a bearish engulfing candlestick will mean the local top is in. The AVAX price could fall by 15% to the 0.382 Fib retracement support at $34 in that case.
Read More: What is Avalanche (AVAX)
Axie Infinity (AXS) Introduces Parts Evolution
- Price: $9.43
- Market Cap: $1,242 billion
- Rank: #63
Axie Infinity announced a new upgrade for Axie Origins. From January 3, “Parts Evolution Utility” will go live, turning Axies into dynamic NFTs that can be improved with time.
The AXS price has increased since falling to a low of $4.05 in October. The next month, the price broke out from a descending resistance trend line that had been in place for 520 days. This led to a high of $11.15 this week.
However, AXS has fallen since it was rejected by the $9.50 resistance area and created a long upper wick (red icon). It is worth mentioning that there are two more days left until the weekly close.
If the AXS price closes above the $9.50 resistance area, it can increase by another 100% and reach the next resistance at $19.
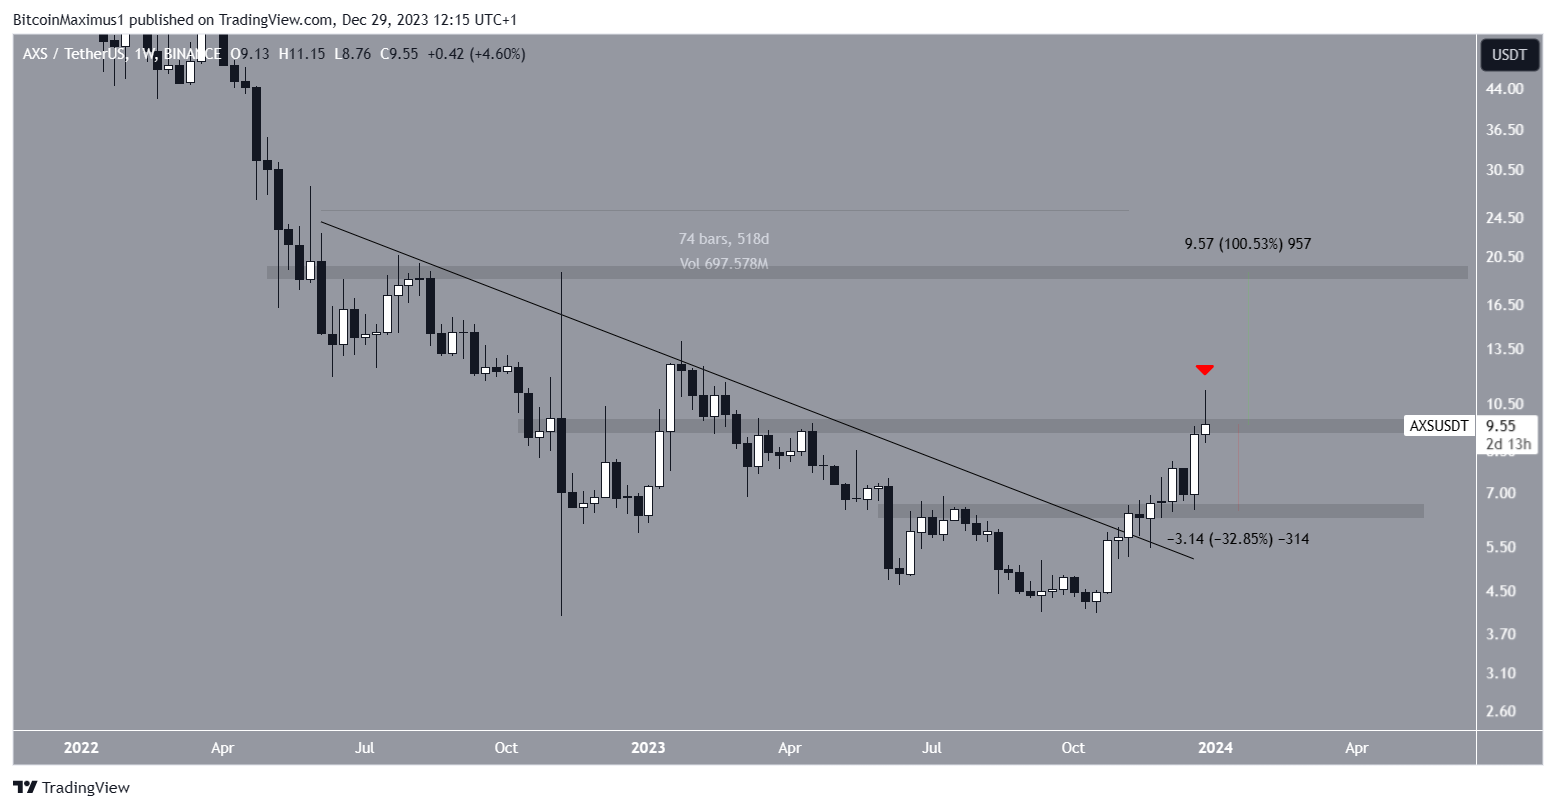
Despite this bullish prediction, if AXS fails to close above $9.50, it could decrease by 33% to the closest support at $6.50.
Read More: Axie Infinity (AXS) Explained for Beginners
Stellar Announces Mainnet Upgrade
- Price: $0.13
- Market Cap: $3,716 billion
- Rank: #25
Stellar network validators have agreed to a January 30 vote on the Mainnet upgrade to Protocol 20. Protocol 20 will implement 12 new Core Advancement Proposals and enable Soroban capabilities, adding a platform for executing smart contracts to the Stellar Network.
The XLM price has increased since October when it broke out from a descending resistance trend line. Since then, it has made three unsuccessful breakout attempts (red icons) above the 0.382 Fib retracement resistance level of the previous decrease at $0.14.
Since resistances weaken each time they are touched, an eventual breakout is likely. This could trigger a 20% increase to the next resistance at $0.16.
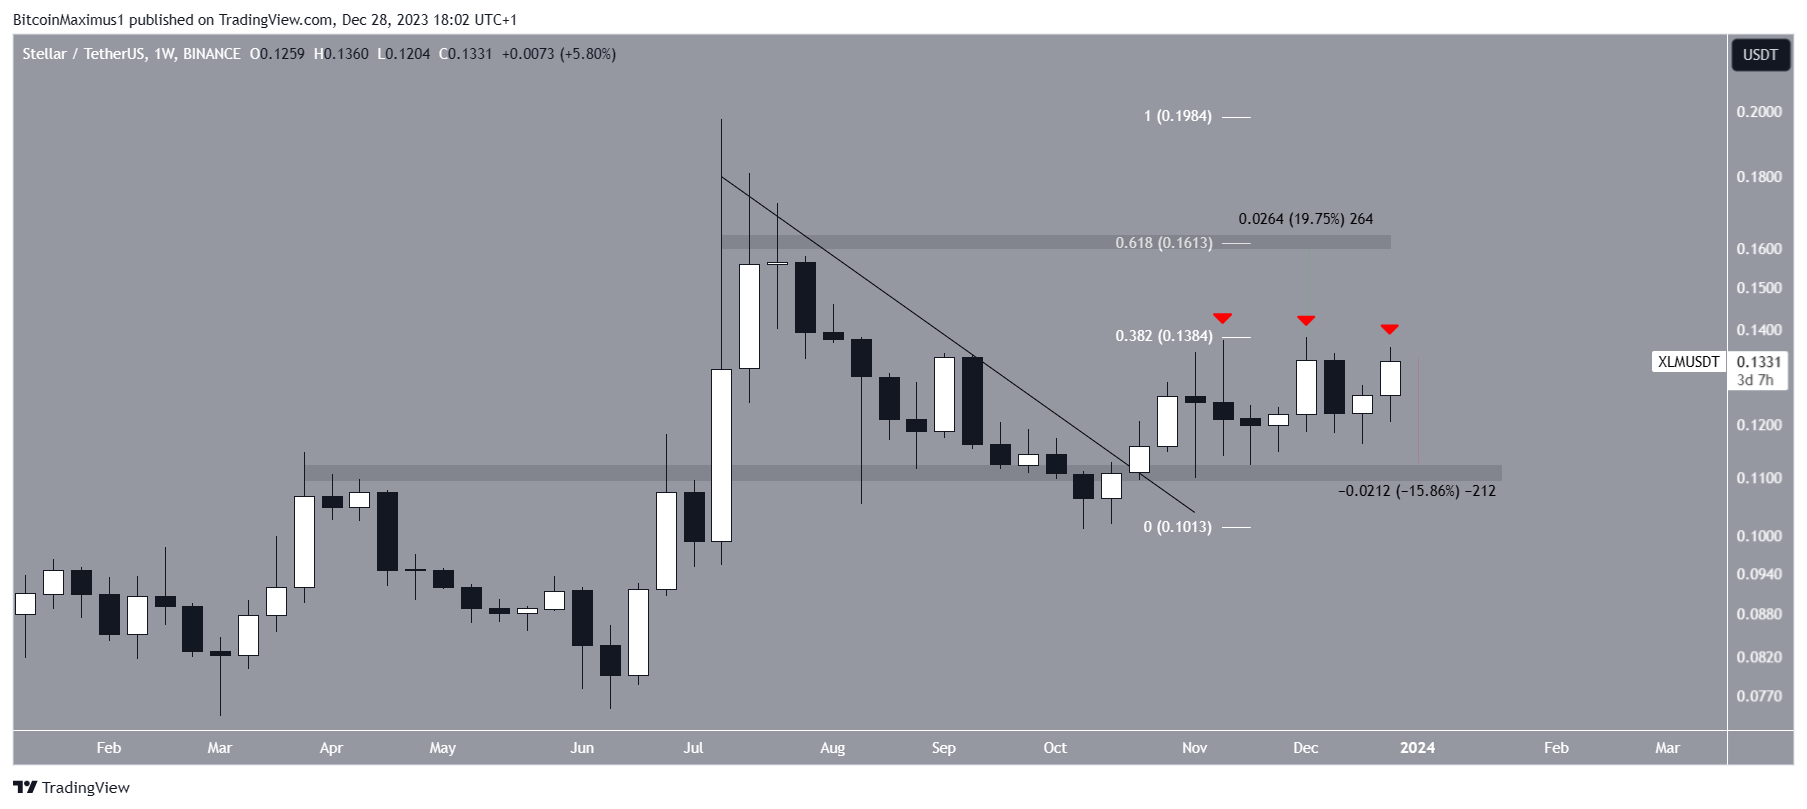
Despite this bullish XLM price prediction, failure to break out can trigger a 15% drop to the closest support at $0.11.
Read More: How to Buy Stellar (XLM)
NEAR Concludes January Altcoins to Watch
- Price: $3.83
- Market Cap: $3,852 billion
- Rank: #23
The NEAR Protocol team issued an update on NEAR Block Explorers. While the original NEAR Block Explorer was initially important to the blockchain, alternative block explorers have now surpassed it.
As a result, the NEAR Block Explorer Selector went live in October, and the original Explorer will be turned off on January 31. This is done to allow users and developers to pick their own favorite community-built explorers.
Similarly to the other January altcoins, NEAR broke out from a descending resistance trend line in October. The increase caused a breakout above the $3.20 resistance area and led to a new yearly high of $4.62 this week. This area is now expected to provide support.
If the breakout continues, NEAR can increase by another 50% and reach the next resistance at $6.
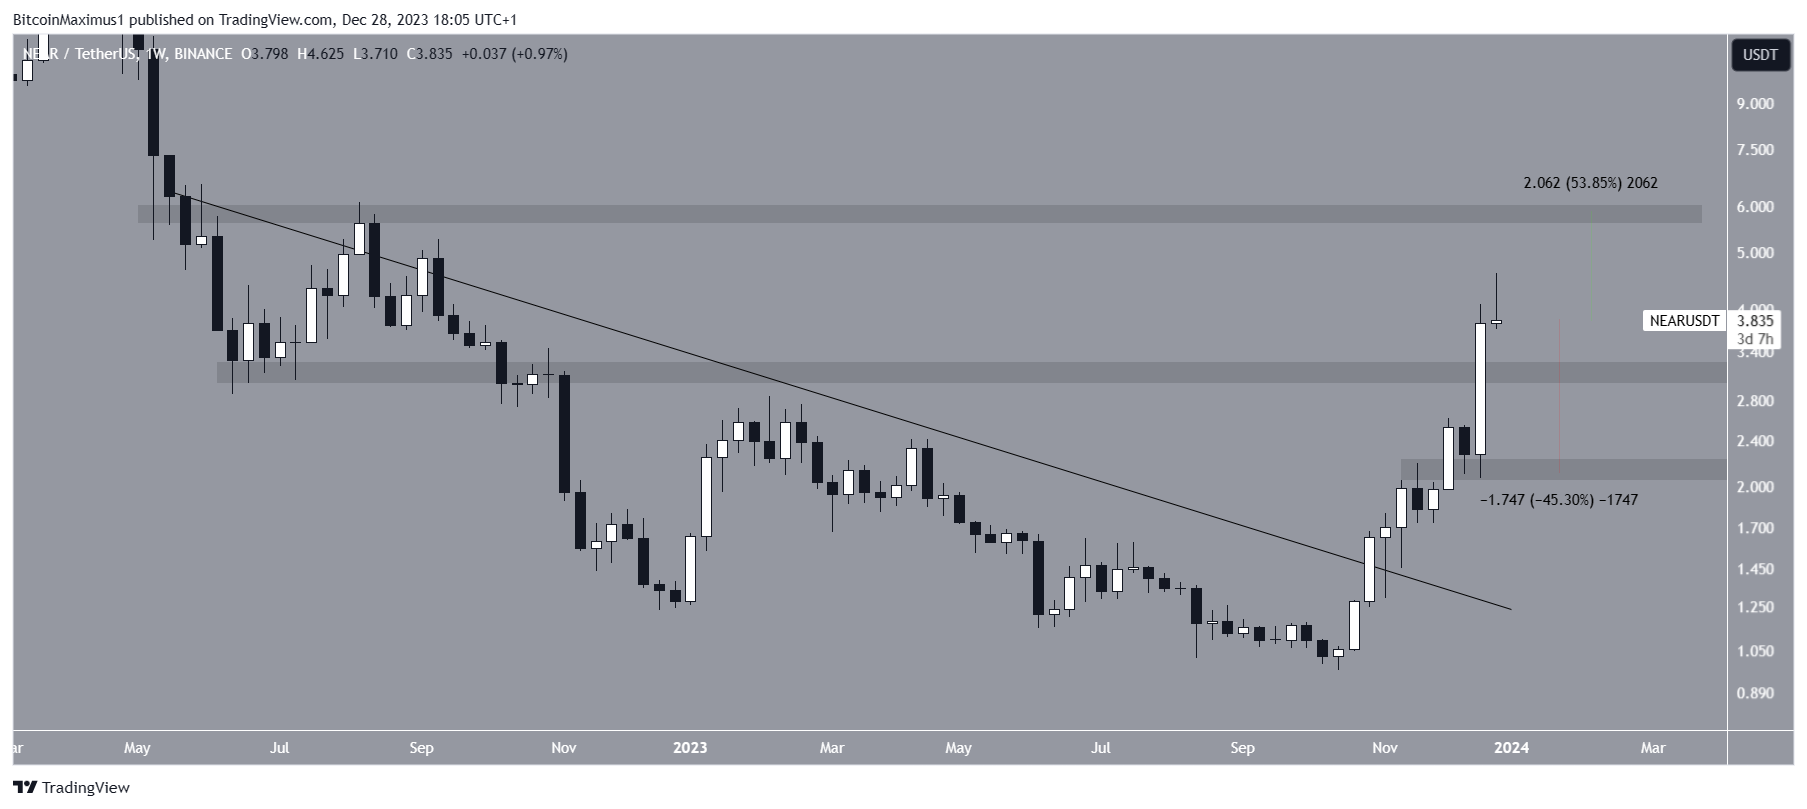
Despite this bullish NEAR price prediction, a close below $3.10 will invalidate the breakout. Then, NEAR could fall by 45% to the closest support at $2.10.
For BeInCrypto’s latest crypto market analysis, click here
Disclaimer
In line with the Trust Project guidelines, this price analysis article is for informational purposes only and should not be considered financial or investment advice. BeInCrypto is committed to accurate, unbiased reporting, but market conditions are subject to change without notice. Always conduct your own research and consult with a professional before making any financial decisions. Please note that our Terms and Conditions, Privacy Policy, and Disclaimers have been updated.

Leave a Reply