- XTZ price jumped more than 7% on Wednesday to break above $3.00.
- The cryptocurrency’s value could hit over $13.00 in the next two or three months if bulls hold above a critical support level.
- The gains could reach 450%, says Ali Martinez.
Tezos has traded higher in the past 24 hours, breaking above $3.00 after a 7% jump aided by a broader upside in the crypto market.
As of writing, the native XTZ token is changing hands around $3.18, having raced to an intraday high of $3.23. Looking at the XTZ/USD chart, we see the cryptocurrency has moved higher from late January support levels.
Another surge could push the token’s price even higher, especially if bulls hold key support levels in the face of prevailing market conditions. If not, a fresh downside could push prices to new lows below $2.00.
Analyst says Tezos could rally 450% or more
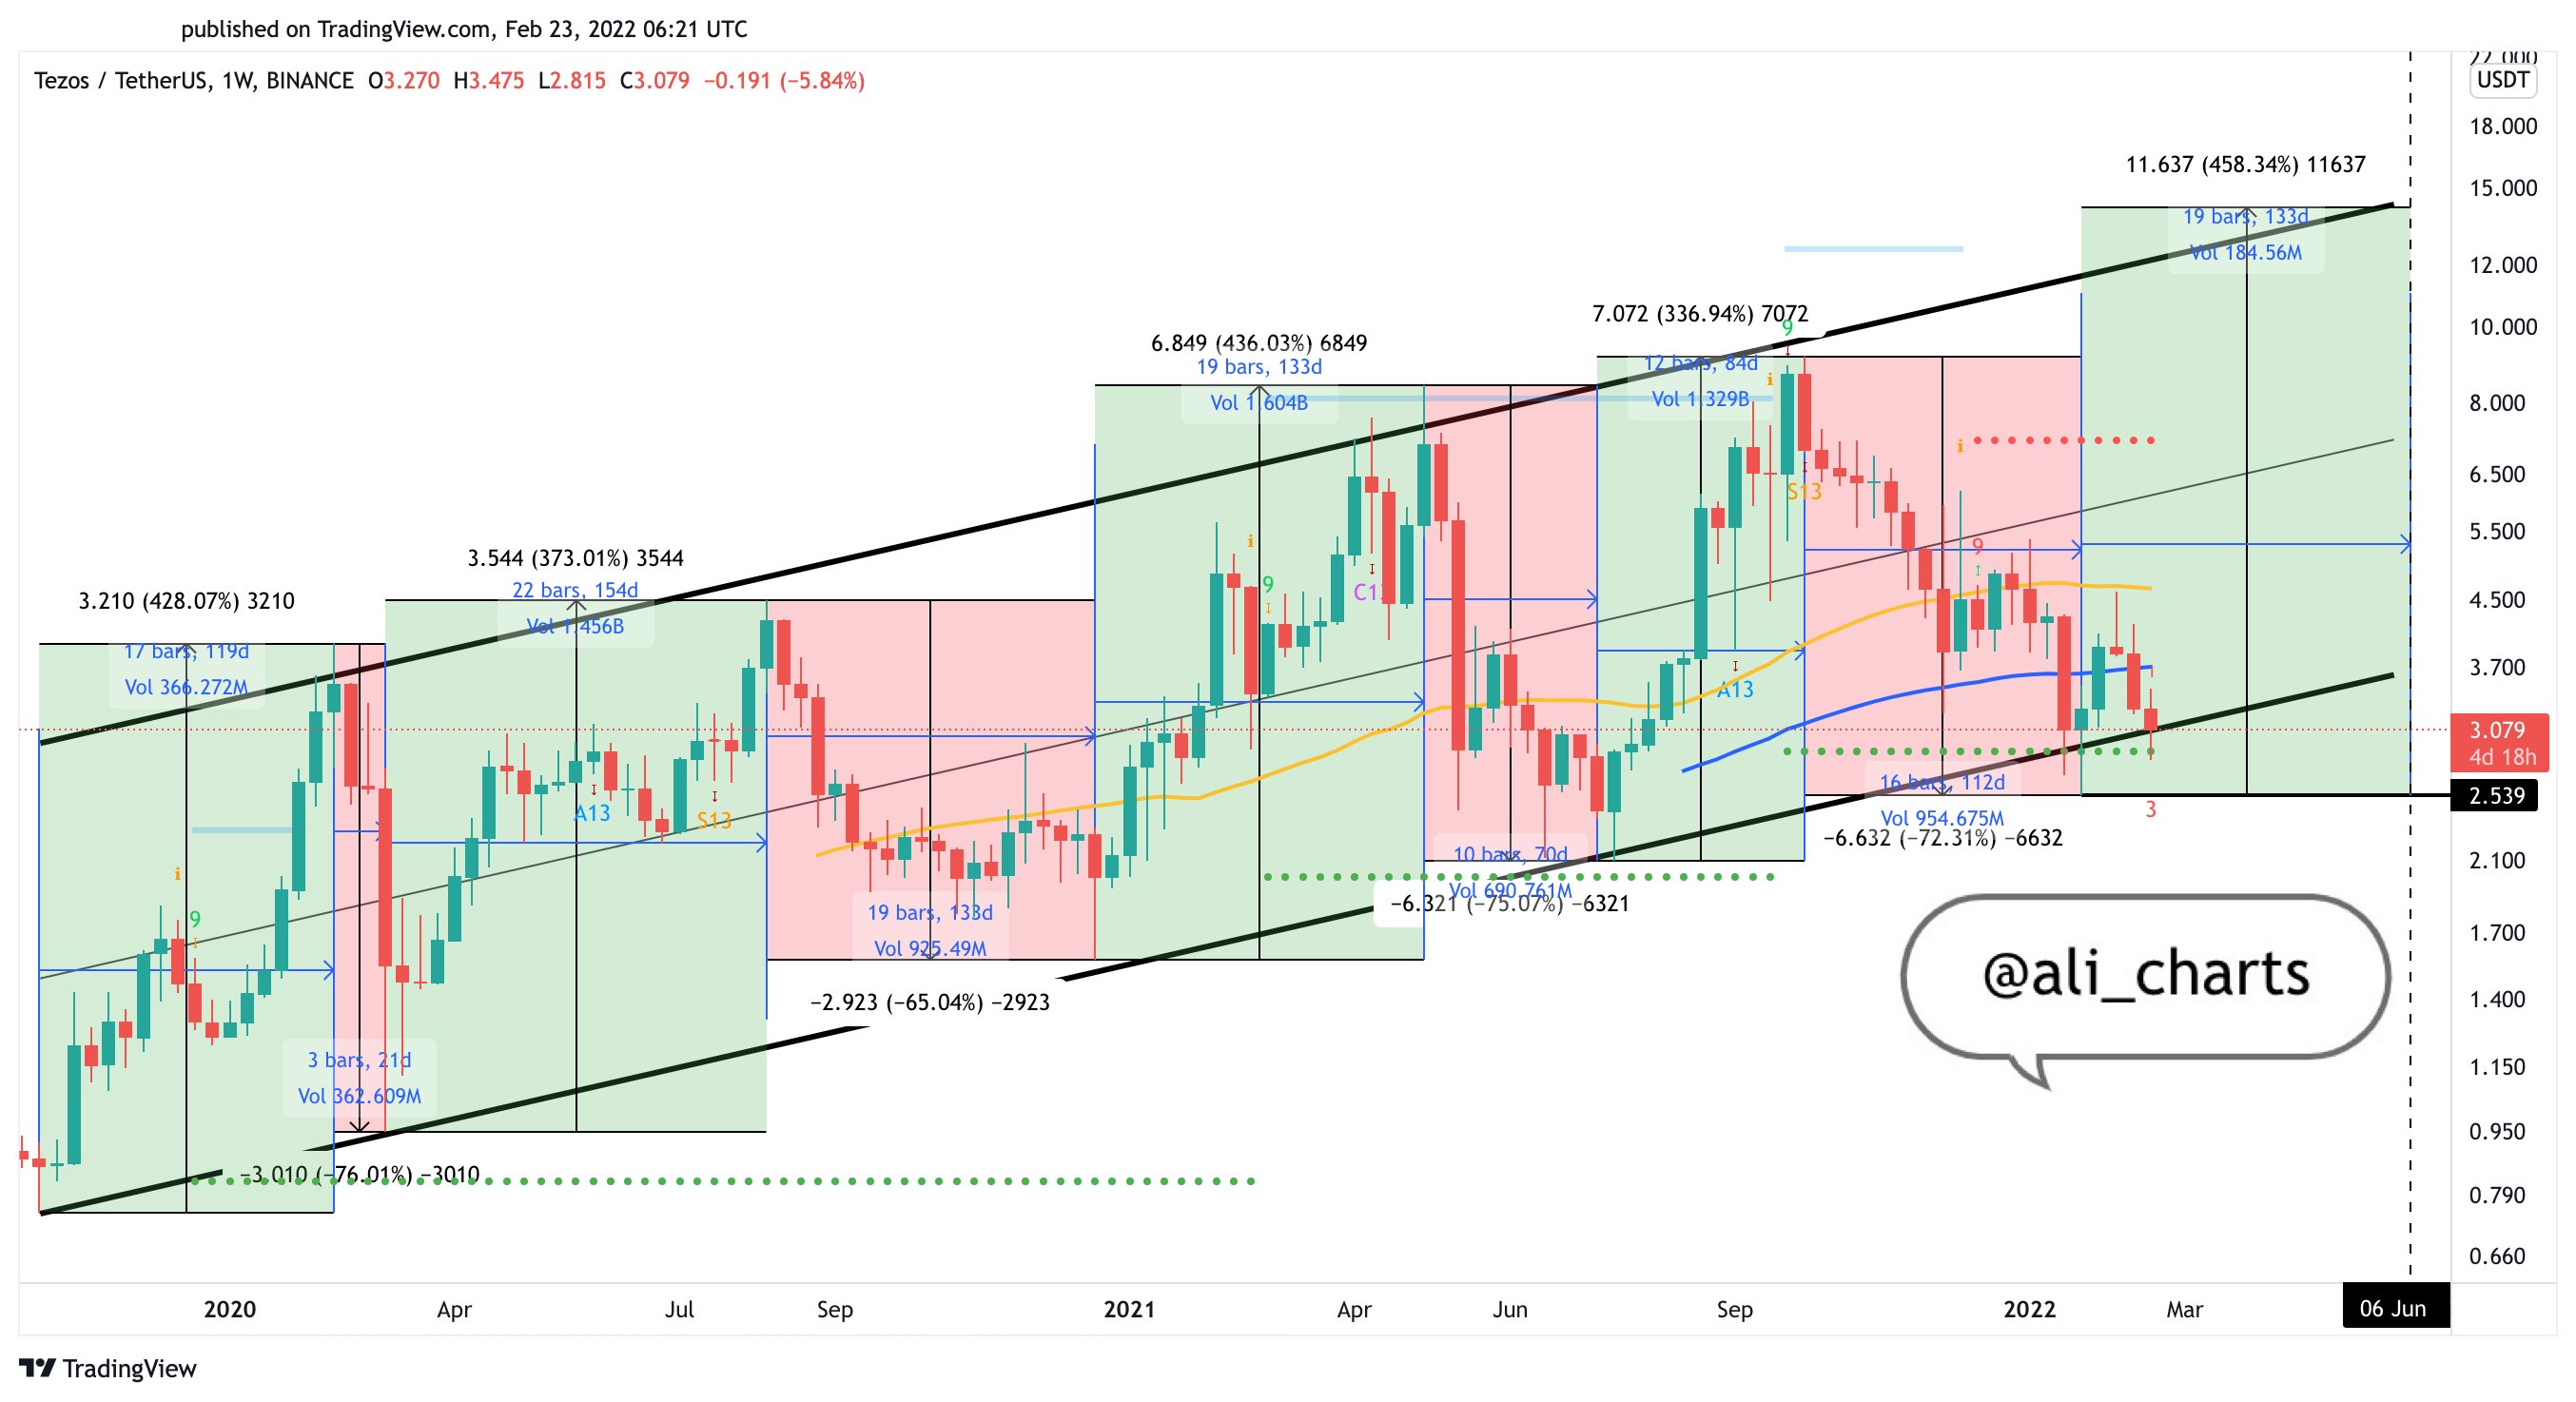
The above outlook is shared by crypto analyst Ali Martinez. According to the analyst, the XTZ price on the weekly log suggests a potential 450%+ jump if bulls hold to keep prices within an ascending channel since October 2019.
“If the channel’s lower edge around $2.50 continues to hold, XTZ could rise to the pattern’s upper trendline at $13.6,” he noted on Twitter before the coins bounce above $3.00.
As outlined by the analyst, the upside to the channel’s upper boundary could mean a massive rally in the region of 458%. Has Tezos rallied this hard before?
In September 2020, Tezos’ price fell more than 60% before a huge rally took it from lows of $1.70 to highs above $8.00. The bull market bounce from that bottom topped with XTZ price more than 430% up around April 2021.
The lower trendline that has acted as support as recently in September last year could yet offer the buffer bulls require to make another upside assault.
But if downside pressure, likely from macro factors such as the Russia-Ukraine crisis, Fed’s rate hikes, and negative crypto regulations, hits, Martinez says to expect a drop below $2.00.
“Breaking the $2.5 support can result in a correction to $1.80,” he tweeted.
 Chart showing XTZ price in a rising parallel channel on the weekly timeframe. Source: Ali Martinez on Twitter.

Leave a Reply