AAVE, BNB, BakeryToken (BAKE) have all increased during the weekend. AAVE is still trading inside a bearish pattern; BAKE attempts to clear a long-term horizontal resistance, while BNB has created a bullish pattern.
Despite the cryptocurrency market maintaining stability during the weekend, certain digital currencies saw significant increases in value. Consequently, they have earned recognition as the leading altcoin gainers of the weekend in terms of performance.
AAVE Leads Altcoin Gainers Over Weekend
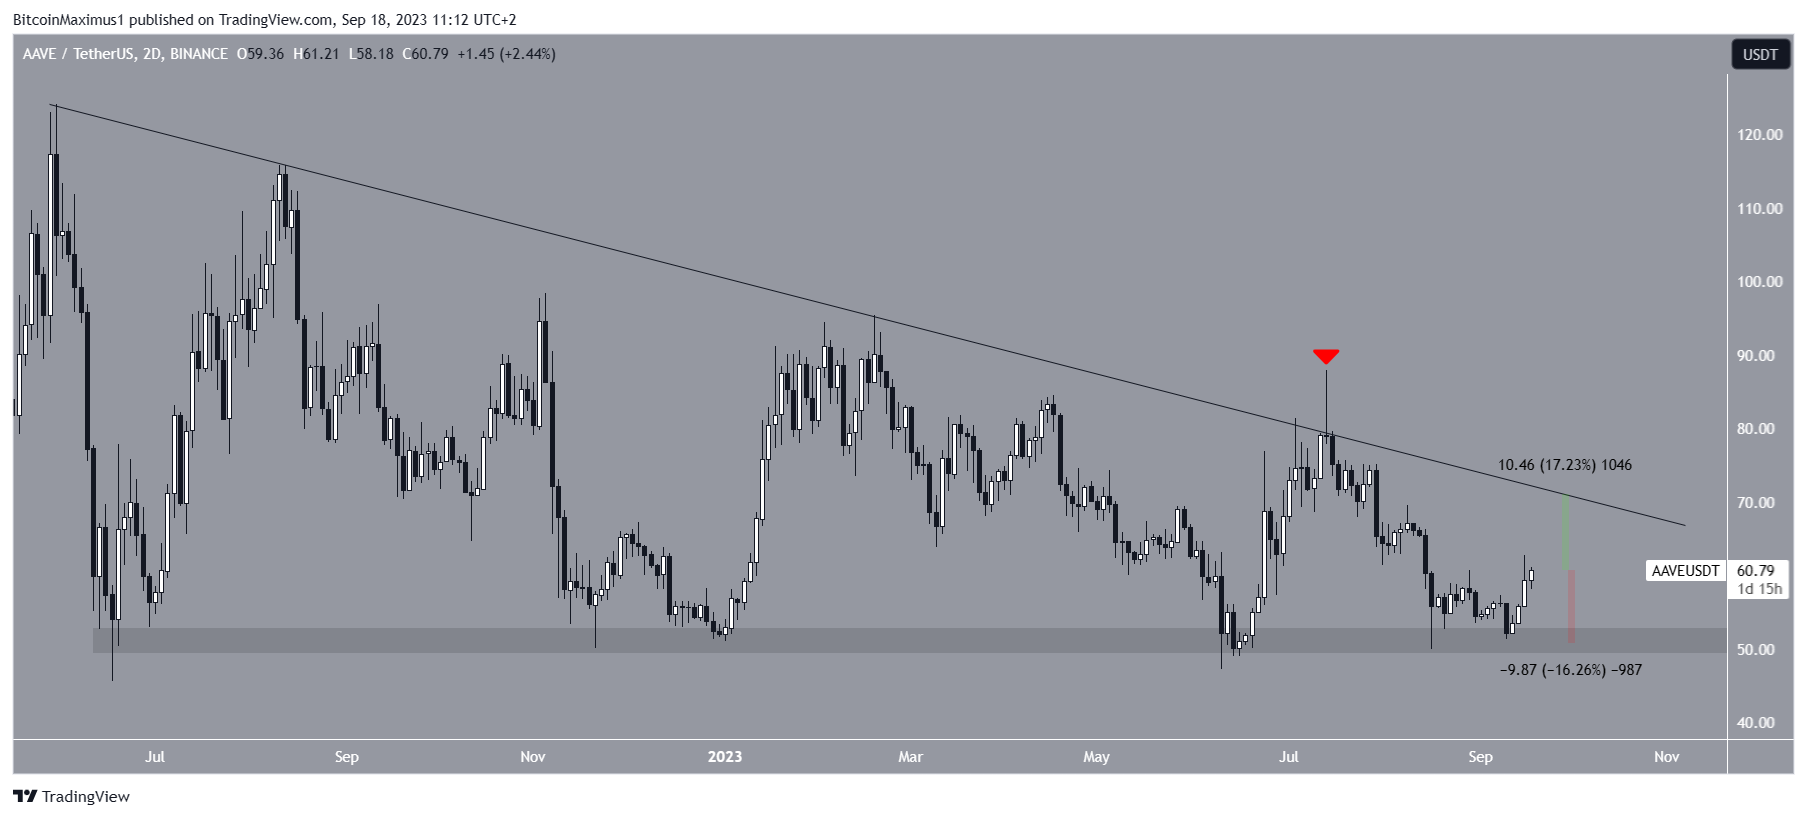
The AAVE price has fallen under a descending resistance line since the end of June 2022. The line has been validated numerous times, most recently in July 2023 (red icon). This created a long upper wick, invalidating the ongoing breakout.
Afterward, the AAVE price fell to the $50 horizontal support area, which has been in place as long as the descending resistance line.
The resistance line and the $50 area created a descending triangle, considered a bearish pattern. Therefore, the most likely future movement is an eventual breakdown from the triangle.
However, the price could continue consolidating between the support area and the resistance line before an eventual movement outside of its confines.

An upward movement to the resistance line at $70 will increase 17%, while a drop to the $50 support area will decrease 16%.
BAKE Price Attempts Breakout From Resistance
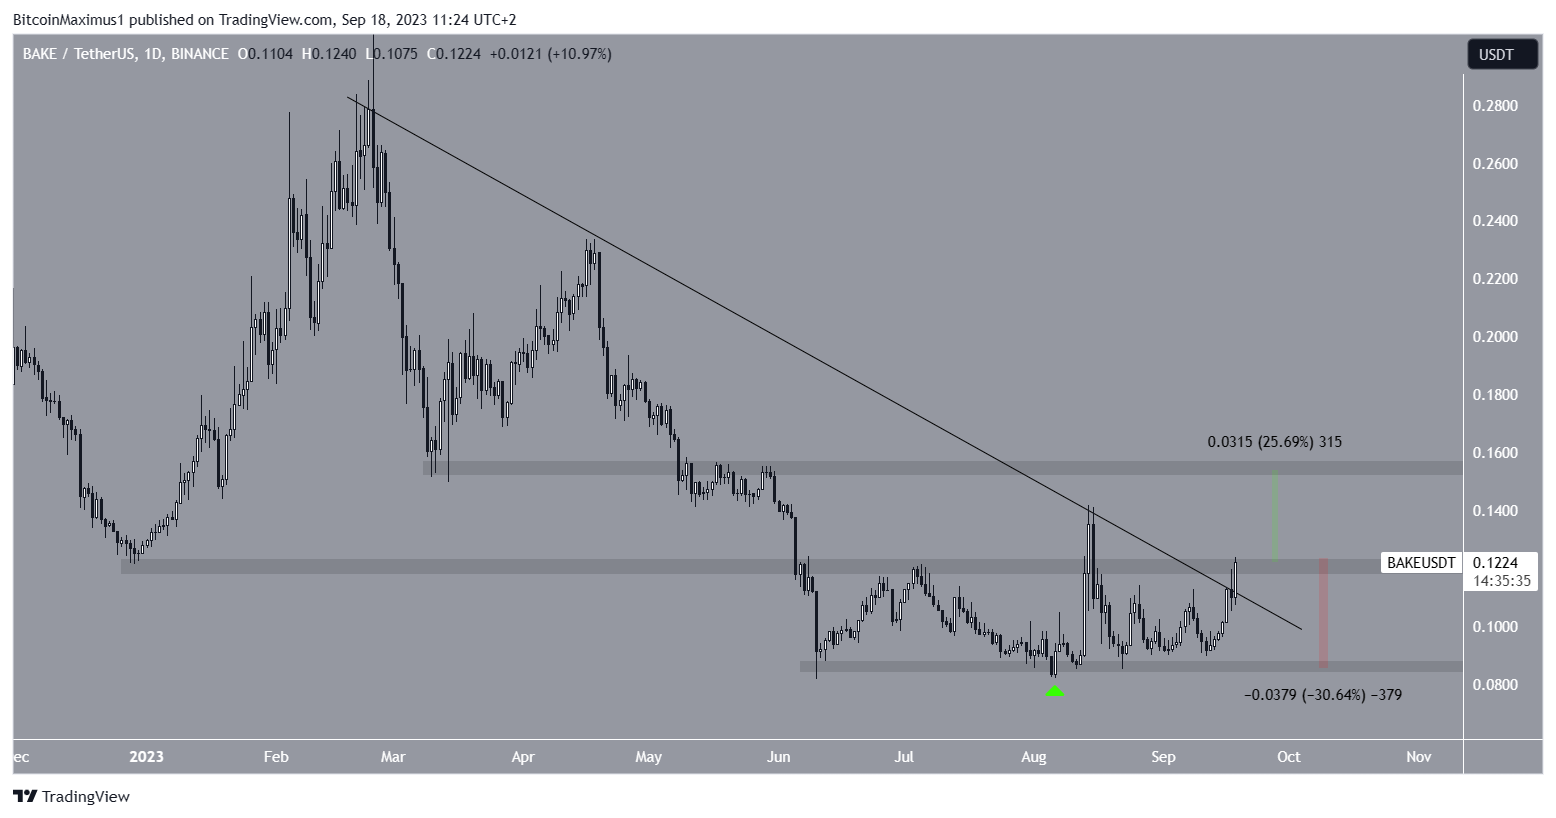
The BAKE price has traded above the $0.085 horizontal support area since June 6. More recently, the price bounced at the support area on August 6, creating a higher low and initiating an upward movement.
Currently, BAKE is in the process of breaking out from a descending resistance line that has been in place since February. However, it has yet to reach a close above it and still trades inside the $0.120 horizontal area.

If the price breaks out, it can increase by 25% and reach the next resistance at $0.155. However, if it fails to do so, a 25% drop to the $0.085 horizontal area will be likely.
BNB Price Creates Double Bottom Pattern
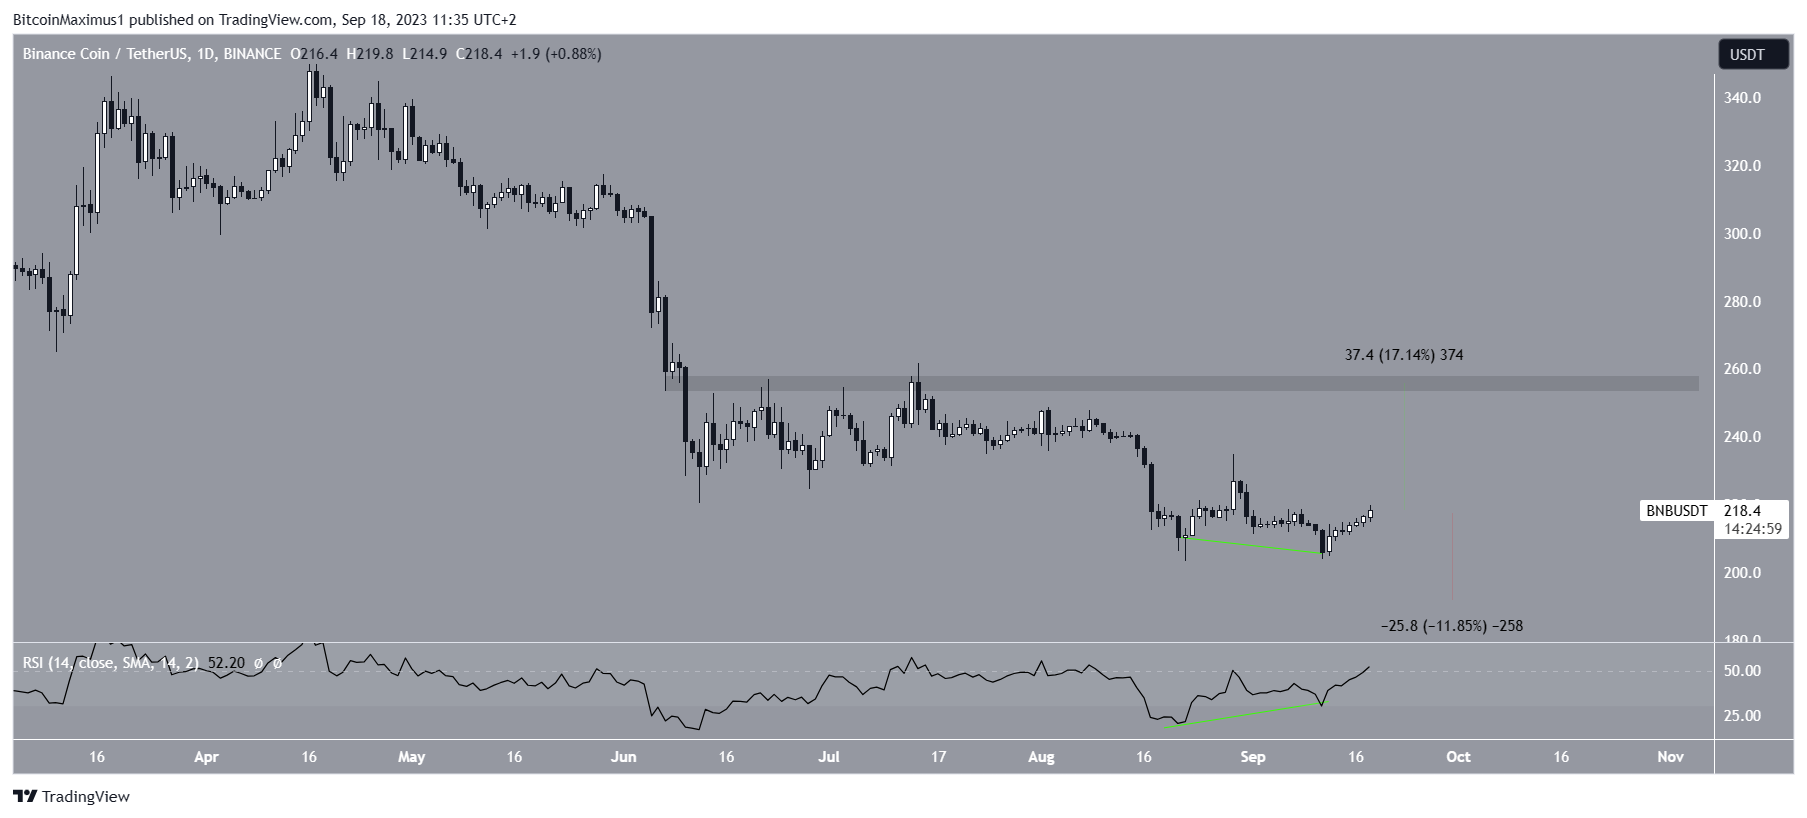
The BNB price created a double bottom pattern between August 21 and September 10. The double bottom is considered bullish, meaning that it usually leads to bullish trend reversals.
Furthermore, the pattern was combined with a bullish divergence in the RSI. A bullish divergence occurs when a momentum increase accompanies a price decrease. It is a bullish sign that often leads to significant increases, aligning with the double bottom pattern.

If an upward movement follows, the price can increase by 17% and reach the next resistance at $255. However, if the upward movement fails to materialize, a 12% drop to $190 will likely be the future price outlook.
For BeInCrypto’s latest crypto market analysis, click here.
Disclaimer
In line with the Trust Project guidelines, this price analysis article is for informational purposes only and should not be considered financial or investment advice. BeInCrypto is committed to accurate, unbiased reporting, but market conditions are subject to change without notice. Always conduct your own research and consult with a professional before making any financial decisions.

Leave a Reply