September was a slightly bullish month for the cryptocurrency market. The pace picked up during the end of the month, especially in the Bitcoin (BTC) price.
While October began with a significant increase, these three bearish cryptos still have a negative outlook, indicating that the worst is yet to come.
Apecoin (APE) Nearly Falls Below $1
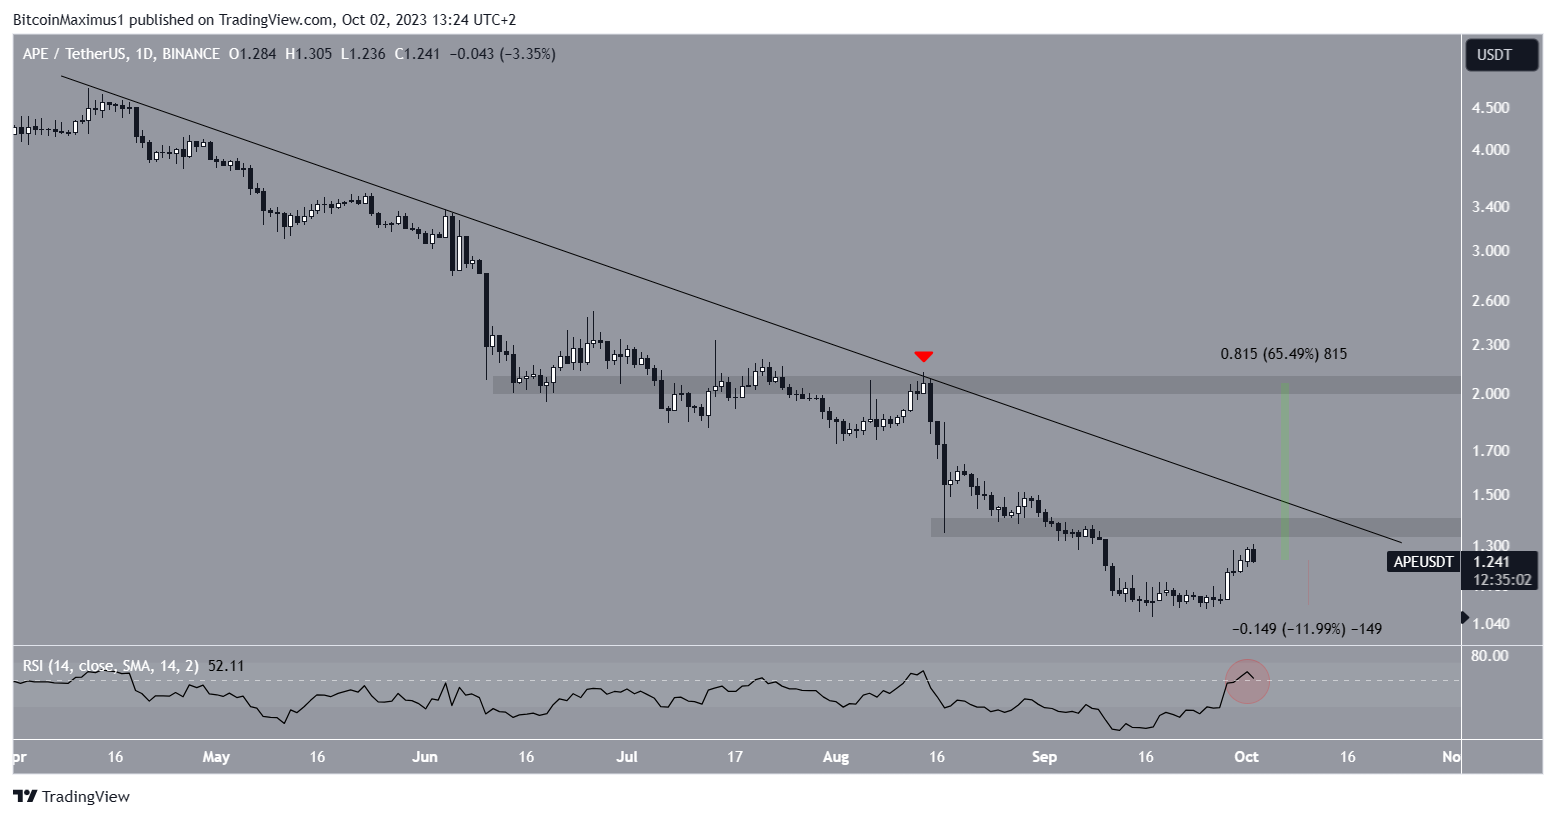
The APE price has fallen under a descending resistance trendline since April 12. The trendline has been validated numerous times, most recently on August 14 (red icon).
The rejection accelerated the rate of decrease and led to a new all-time low of $1.06 on September 17. The price has increased since.
Despite the increase, APE has not yet reached the descending resistance trendline. Also, it is trading below the $1.40 horizontal area, which is likely to provide resistance. The fact that the line coincides with the area increases its importance.
The daily RSI does not help to determine the future trend’s direction.
The RSI is a popular metric among traders for gauging momentum and informing their buy or sell decisions on assets. A reading over 50, especially in an uptrend, is considered bullish, while a reading under 50 is considered bearish.
If the RSI reading is above 50 and the trend is upward, bulls still have an advantage, but if the reading is below 50, the opposite is true. While the RSI is increasing, it is still below 50 (red circle). This is a sign of an undetermined trend.

A breakout from the trendline will likely lead to a 65% increase to the next resistance at $2.
However, if the price fails to clear the $1.40 resistance, it can decrease by 12% and fall to the $1.05 horizontal support area.
Chiliz (CHZ) Struggles With Long-Term Resistance
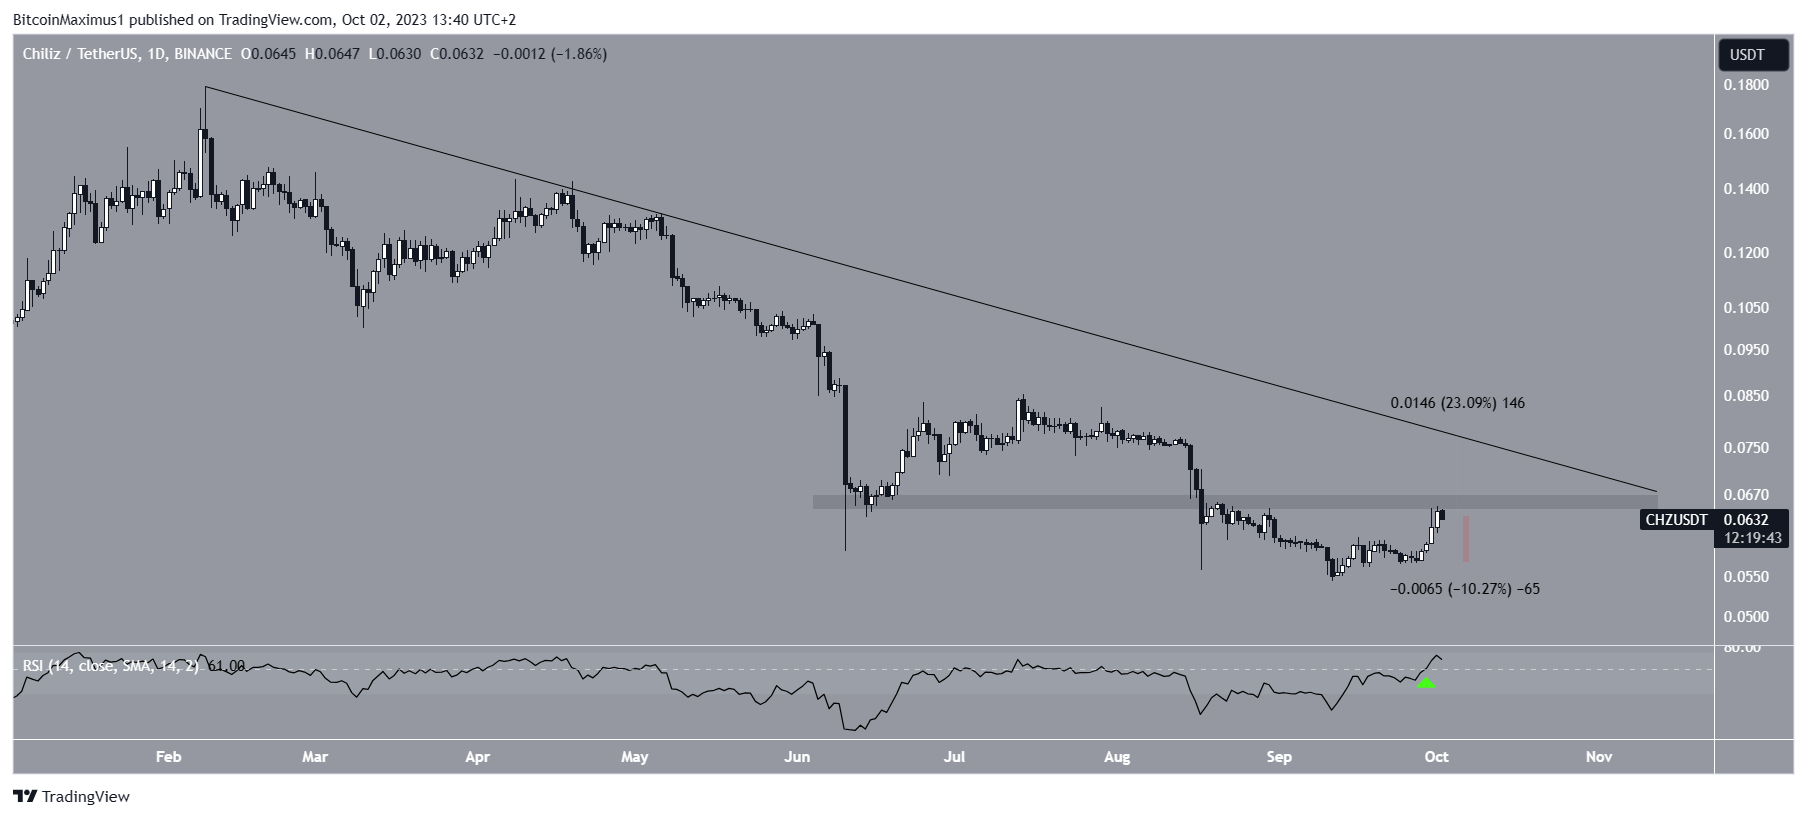
Similarly to APE, the CHZ price has fallen under a descending resistance trendline since the beginning of the year. The decrease culminated with a low of $0.055 on September 11.
The price bounced afterward and has increased since.
Chiliz has nearly reached the main horizontal resistance at $0.065. The area has intermittently acted as both support and resistance since June. So, it is crucial that the price clears it for the trend to be considered bullish.
The daily RSI supports the possibility of a breakout since it has moved above 50 (green icon) and is increasing.

Even though the RSI is bullish, the proximity to the long-term descending trendline reduces the scope of potential increases. A breakout above the $0.065 area will likely lead to an increase of only 23%, reaching the descending resistance trendline at $0.077.
On the other hand, a rejection from the $0.065 area will likely lead to a 10% drop to the closest support at $0.057.
EOS Price Concludes Bearish Cryptos for October
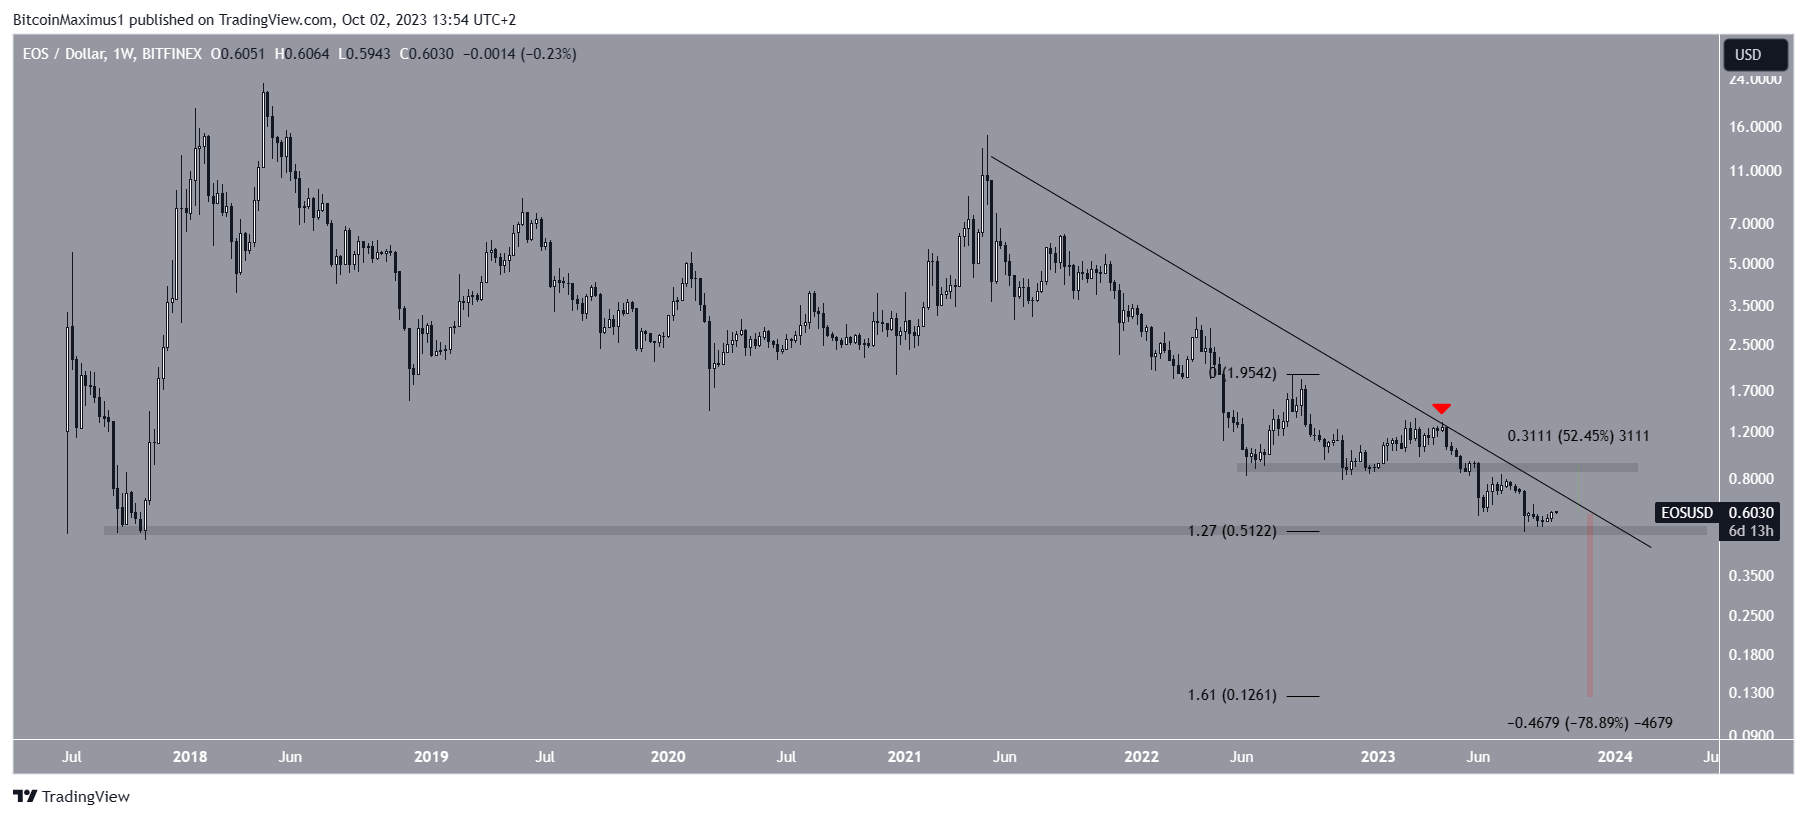
The EOS price has decreased under a descending resistance line since June 2021. More recently, it was rejected by the line in April 2023 and accelerated its rate of decrease.
Then, the price decreased from the $0.90 horizontal support area in June. The breakdown led to a low of $0.50 in August, only slightly above the all-time low price of $0.47.
The price has bounced since but is still below the descending resistance line.

If the EOS price breaks down from the $0.50 area, it can fall by 80% and reach the next Fib support at $0.12.
However, if the price breaks out, it can increase by 50% to the $0.90 area.
For BeInCrypto’s latest crypto market analysis, click here
Disclaimer
In line with the Trust Project guidelines, this price analysis article is for informational purposes only and should not be considered financial or investment advice. BeInCrypto is committed to accurate, unbiased reporting, but market conditions are subject to change without notice. Always conduct your own research and consult with a professional before making any financial decisions.

Leave a Reply