A quant explains how Bitcoin on-chain data may be used to identify whether a high was because of peak formation or due to a shakeout.
Open Interest, Funding Rates, And LTH-SOPR May Signal Whether A Peak Vs A Shakeout
As explained by an analyst in a CryptoQuant post, a combination of different on-chain indicators may be able to identify whether a high means the price is forming a peak or if it’s just a shakeout.
The relevant Bitcoin indicators here are the open interest, the funding rates, and the LTH-SOPR. Before considering the trend of each, here are some quick explanations of what these metrics are.
The open interest is an indicator that shows the total amount of open positions currently on derivative exchanges. It includes both long and short positions.
Funding rates are the periodic payments that futures traders make between each other. Positive values of the metric mean long traders are currently paying a premium to keep their position while negative ones mean short traders are the ones paying.
Finally, the LTH-SOPR, or the Long-Term Holder SOPR, highlights the degree of profit taking from long-term holders. SOPR here stands for Spent Output Profit Ratio.
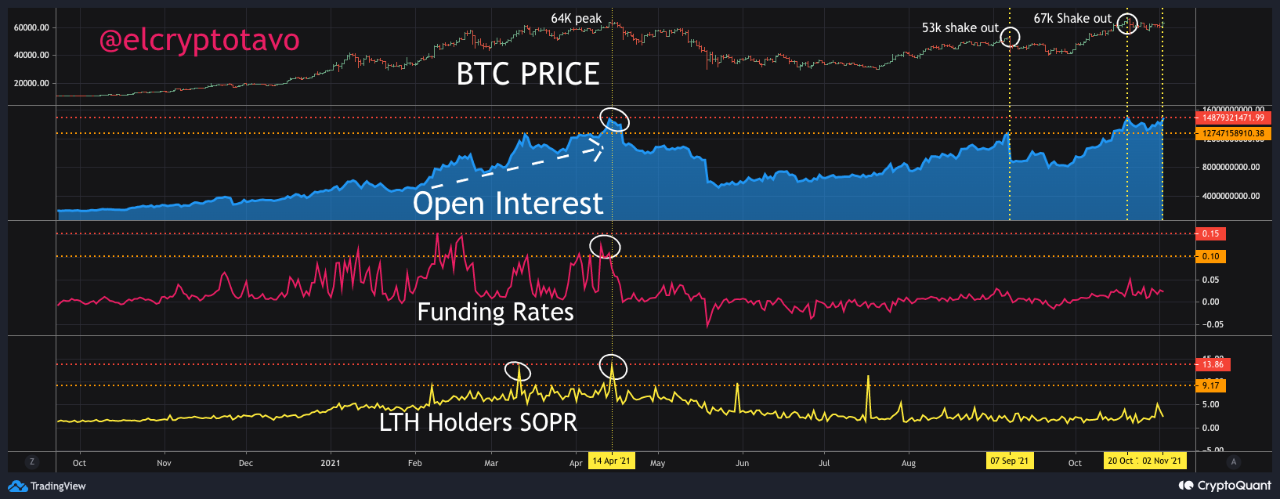
Now, here is a char that compares the trend of each of these indicators against the Bitcoin price:

The relation between these indicators and the peaks and shakeouts | Source: CryptoQuant
The quant has marked important points on the chart where peaks or shakeouts happened. Corresponding to these price points, the aforementioned indicators have shown some interesting trends.
Related Reading | FOMO Beware: Spot Bitcoin Buying Volume Remains Low, Despite New ATH
Based on observations of these trends, the analyst thinks the pattern may be something like this:
If the market is showing high open interest as well as highly positive funding rates, and long-term holders are aggressively taking profits, then a price high formed is a peak.
Related Reading | Despite Decline In Bitcoin Price, Market Remains Greedy
While if high open interest is accompanied by only slightly positive funding rates and few LTH taking their profits, then the market only observes a shakeout.
Bitcoin Price
At the time of writing, BTC’s price floats around $61.7kk, up 1% in the last seven days. Over the past thirty days, the crypto has accumulated 23% in value.
The below chart shows the trend in the price of Bitcoin over the last five days.

BTC price slips back down again | Source: BTCUSD on TradingView
In the last few days, Bitcoin seemed to have made some recovery back above $63k, but since then the price has again dropped back down.
If the pattern with the on-chain indicators discussed earlier holds true, and if the price dips further here, then it would only be a shakeout.
Featured image from Unsplash.com, charts from TradingView.com, CryptoQuant.com

Leave a Reply