

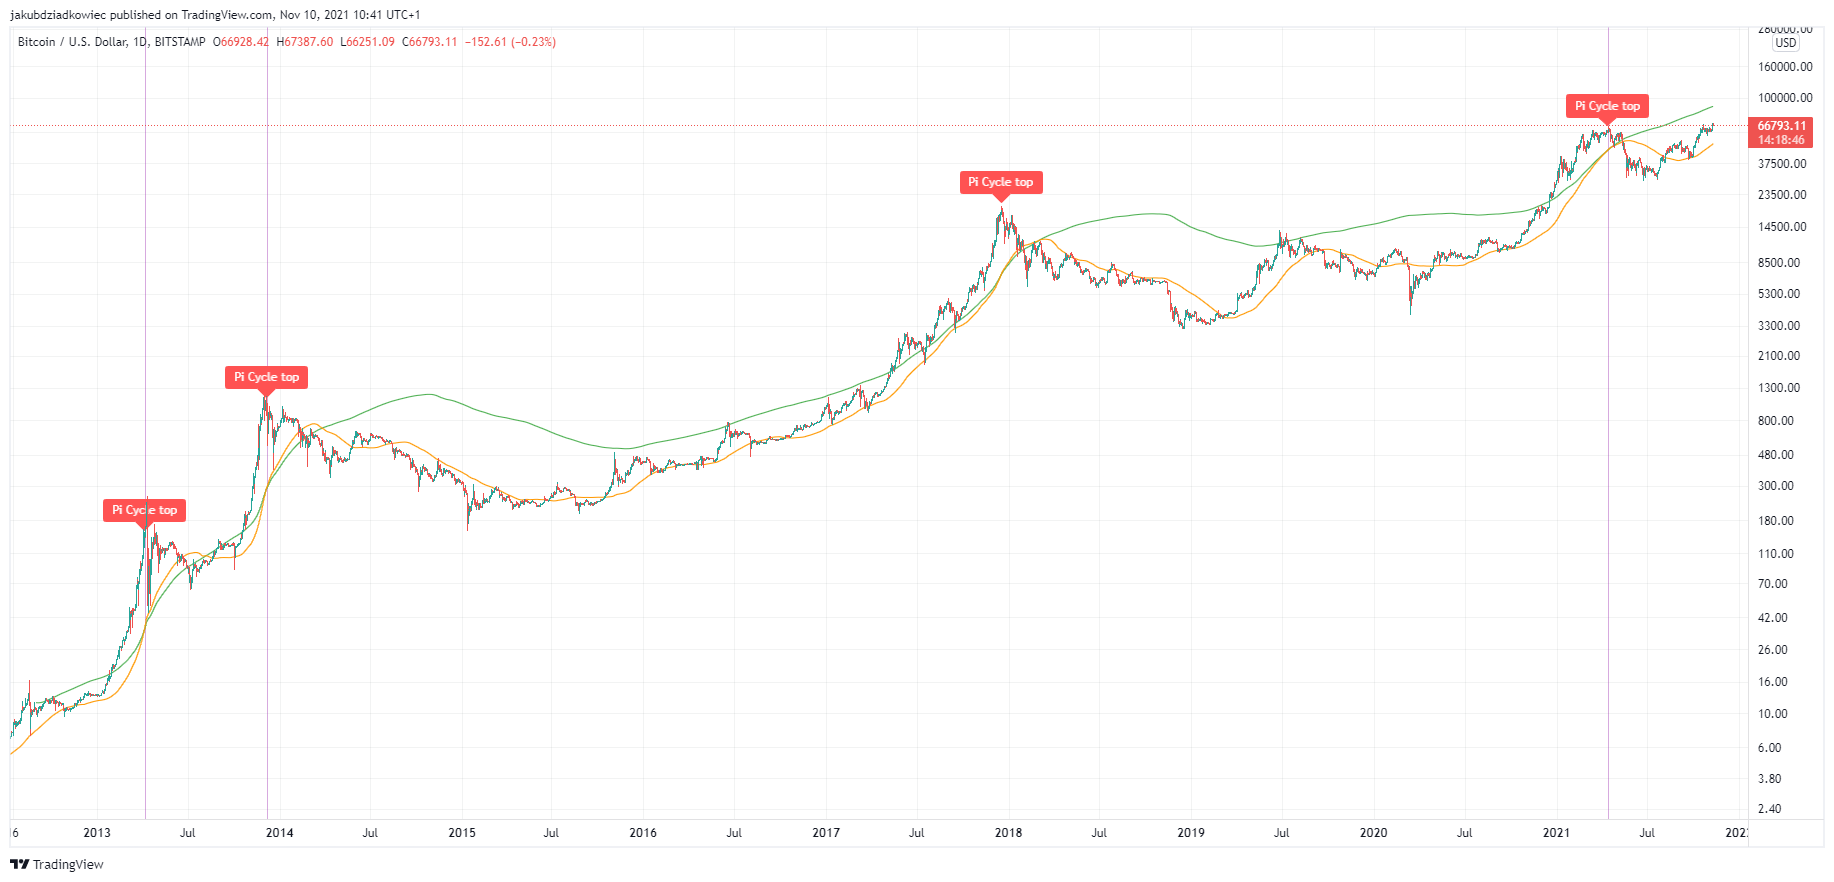
The Pi Cycle Top indicator has gained enormous popularity due to its simplicity and intriguing reliability. Each time, on four occasions now, the signal it has generated has indicated the peak of the Bitcoin price with high accuracy.
Currently, with Bitcoin reaching a new all-time high (ATH) around $68,500, the indicator curves are far apart. However, they have recently started to approach each other again. Does this signal a continuation of the bull market in the crypto market?
What is the Pi Cycle Top indicator?
Pi Cycle Top is a very simple, yet “magically” effective technical analysis indicator. Its “magic” lies in the fact that despite its simplicity, it has predicted 4 historical peaks in the Bitcoin price followed by at least a 55% correction. Created by Philip Swift, the indicator takes into account two displaced moving averages (DMA):
- 350-day DMA x 2
- 111-day DMA
Both moving averages are long-term indicators, but the second one is definitely more responsive as it takes into account a smaller time frame. We get the peak signal from the Pi Cycle Top indicator when the 111-day DMA crosses the 350-day DMA x 2 from below. From the date of this signal, Bitcoin has always peaked with a maximum tolerance threshold of 5 days before or after.

The curves are converging again
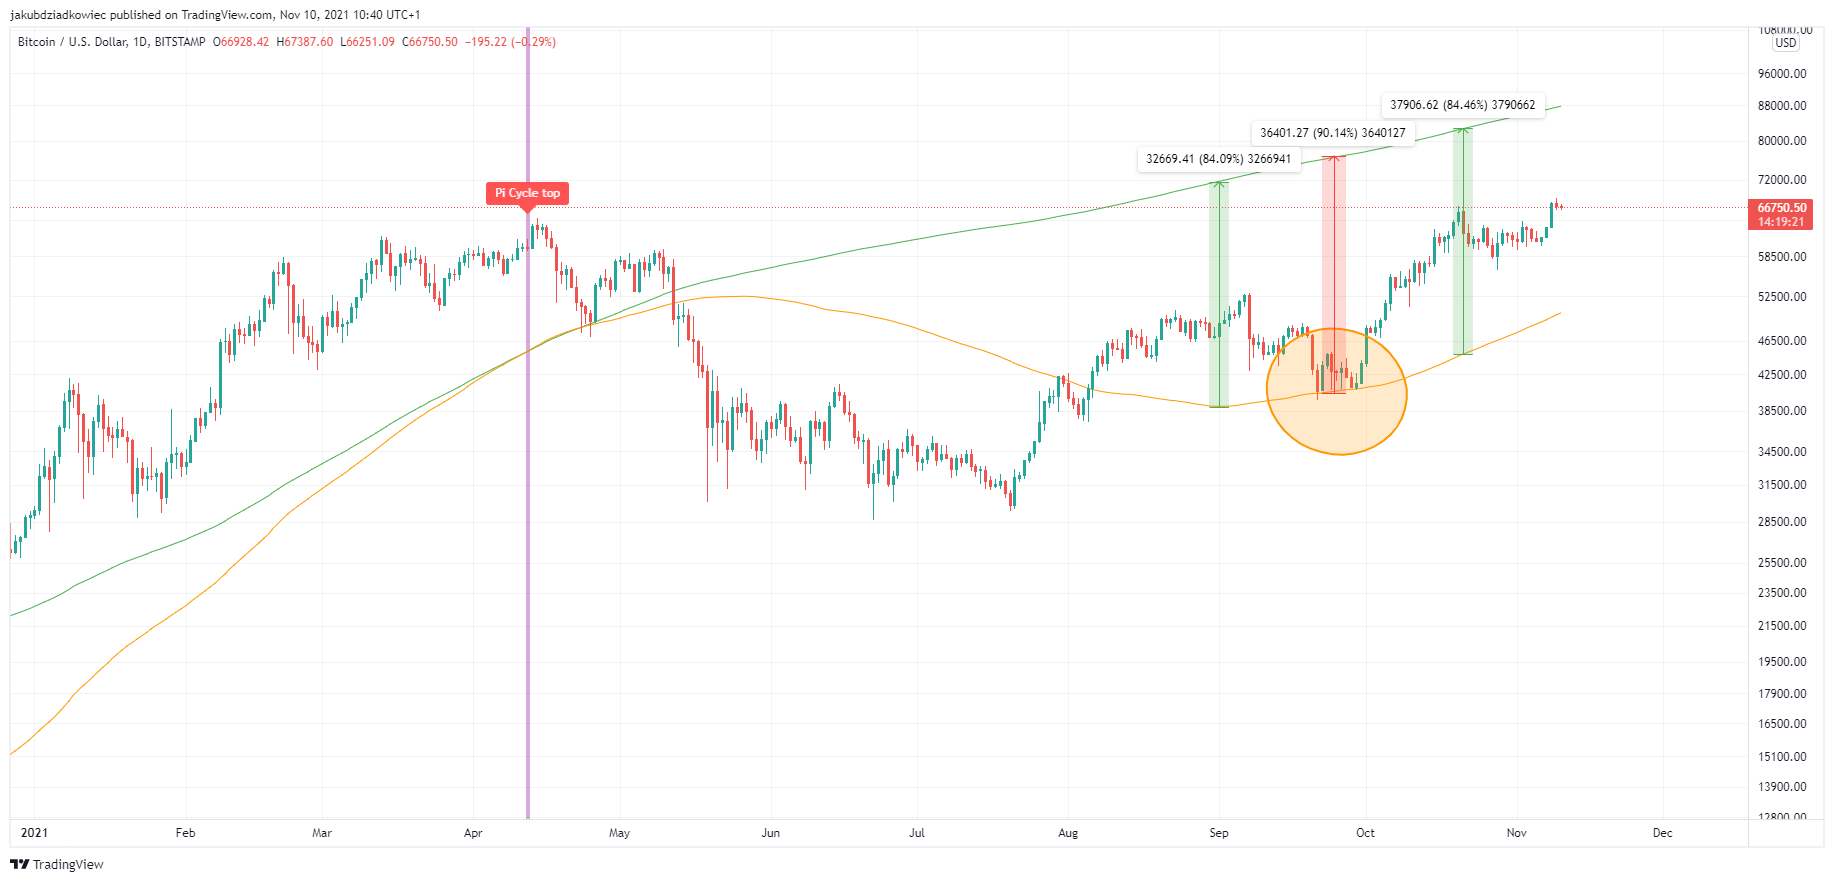
The last intersection of the Pi Cycle Top indicator curves occurred on April 12, 2021. Two days later, on April 14, Bitcoin reached its historic ATH at $64,895 and initiated a correction. The indicator curves started to dynamically diverge just after the May crash to the $30,000 area and the subsequent 3-month consolidation.
However, since the bottom at $29,500 on July 21, the rate of the curves’ divergence began to slow down, the correction came to an end and the BTC price initiated a strong rebound. The indicator curves recorded their maximum distance between 21 and 29 October, when the BTC price fell to $40,500 (orange area). The 350-day DMA x 2 was about 90% above the 111-day DMA (red arrow). Since then, the two moving averages have been moving closer together again.
Cryptocurrency analyst @TheMoneyRaccoon tweeted a chart of the Pi Cycle Top curves today, pointing out a possible scenario of them intersecting again. He also pointed out that the curves have started to converge again.

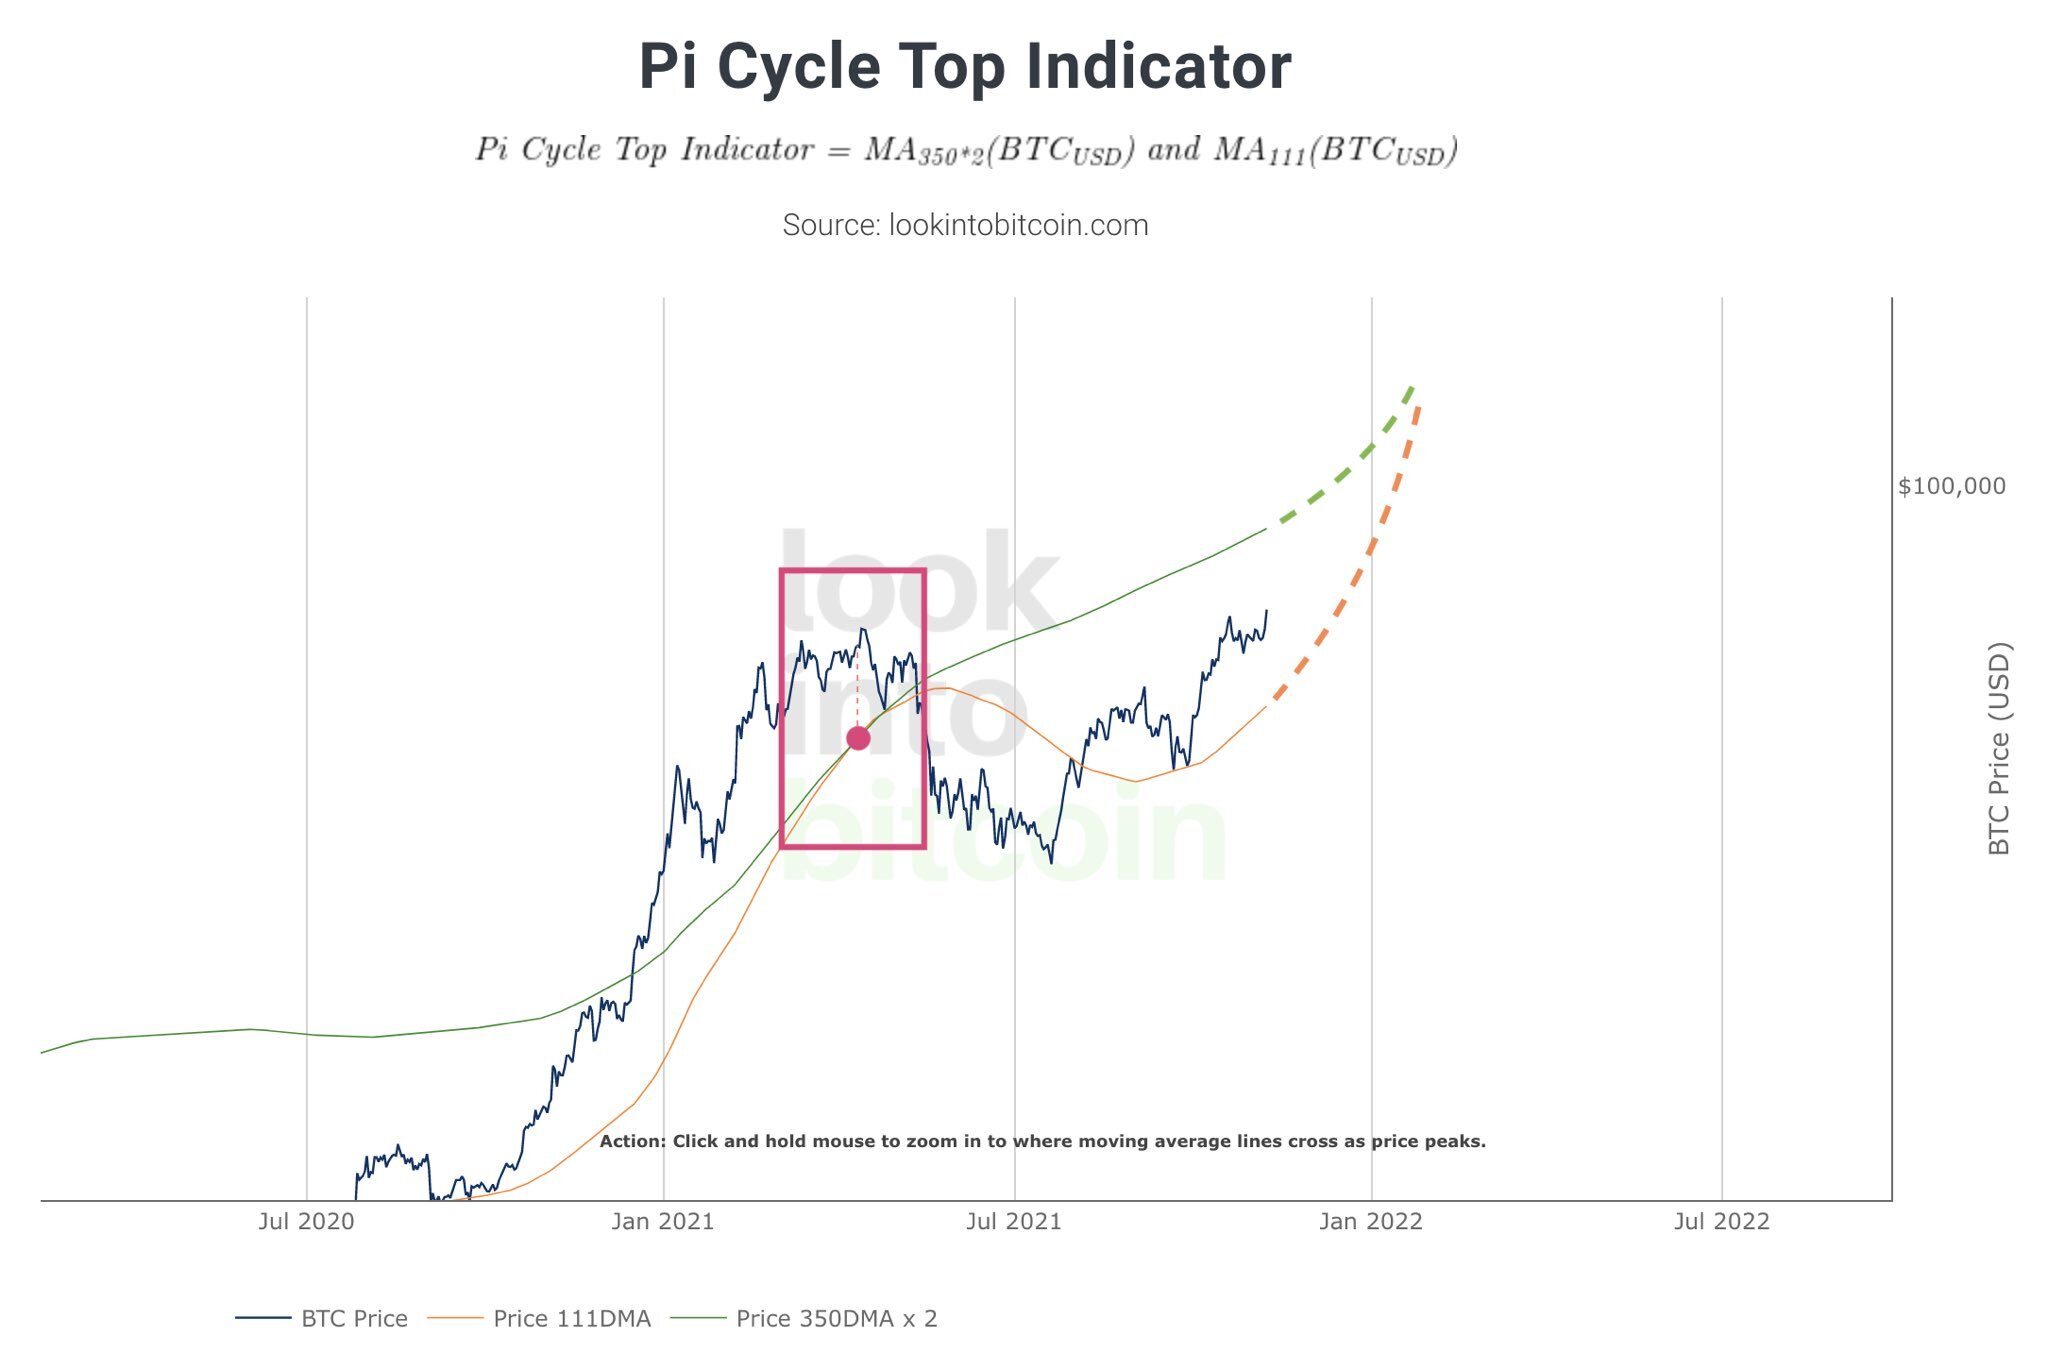
The chart above suggests that the intersection would occur in early 2022. However, for this to happen, Bitcoin’s price action would have to accelerate tremendously, and the price would have to be well above the intersection of the curves. Typically, this has ranged from a few dozen percent (in April 2021) to even a few hundred percent (in 2013) above the intersection.
The hypothetical cross of the Pi Cycle Top indicator curves does not have to happen that quickly, either. If the price action of BTC does not quickly become parabolic, we can expect the movement of the curves to lengthen. This, in turn, will lead to an intersection in the much later period of mid to late 2022.
Pi Cycle Top and the bull market support line
Finally, it is worth mentioning that the beginning of the Pi Cycle Top indicator curves converging again coincided with an important event of BTC technical analysis. This is the holding of the so-called bull market support line, which took place between October 21-29 (orange area). So it happened exactly when the Pi Cycle Top curves stopped moving away from each other.
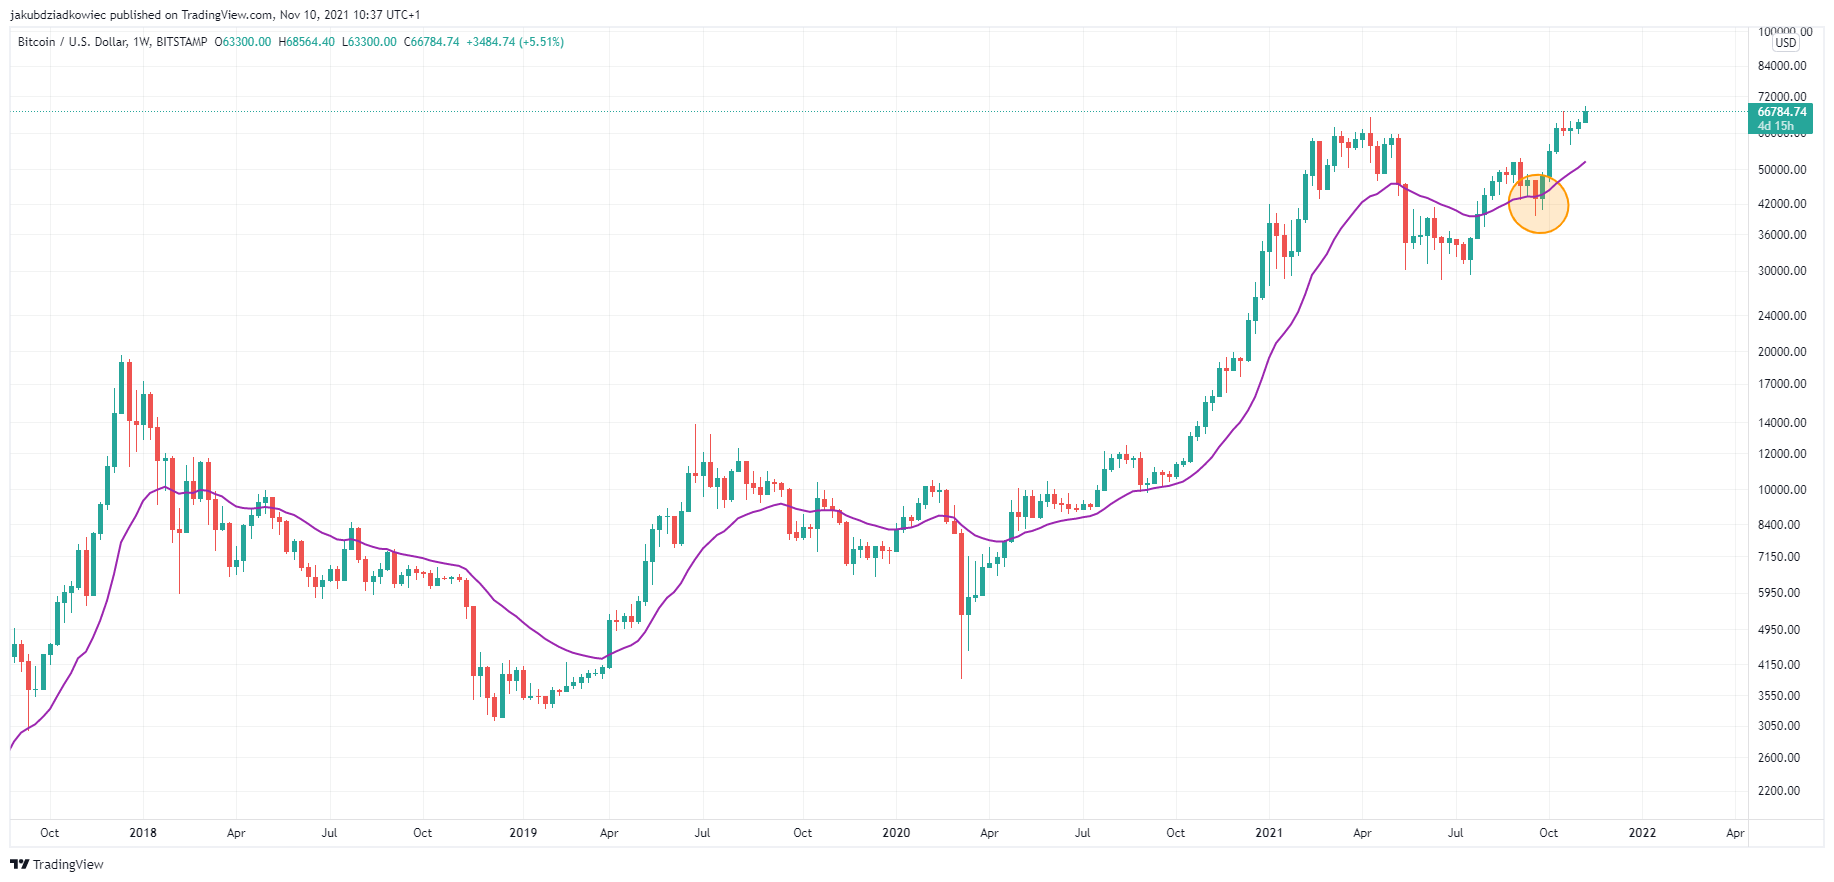
In long-term technical analysis of the Bitcoin price, it is usually assumed that the 21-period exponential moving average (21 EMA) on the weekly chart marks the bull market support line (pink). Price action above this line and regular bounces off it have historically been a signal of an ongoing bull market. Drops below, combined with its bearish validation, initiated a bear market.
The confluence of these two events – the maintenance of the bull market support line and the beginning of the Pi Cycle Top indicator curves converging again – is noteworthy. If one juxtaposes these signals with bullish on-chain data on Bitcoin mining, it is hard to avoid the conclusion that sizable rises in the cryptocurrency market are yet to come.
For BeInCrypto’s previous Bitcoin (BTC) analysis, click here.
Disclaimer
All the information contained on our website is published in good faith and for general information purposes only. Any action the reader takes upon the information found on our website is strictly at their own risk.
Leave a Reply