

The Bitcoin market is a place of constant clash between bulls and bears. Often, these animals take the form of short-term and long-term holders who are constantly trading coins with each other.
When short-term holders are buying, it often signals market tops. Conversely, purchases by the latter usually mark market lows. However, in situations where both types of holders are in profit – we have a bull market situation. In the opposite situation, when everyone records losses – a deepening bear market.
In today’s on-chain analysis, BeInCrypto looks at indicators of the behavior of both types of holders. The goal is to try to determine from their behavior what market stage Bitcoin is at.
Has the bottom already been reached and an uptrend should be expected? Are we in for a long consolidation and a multi-month sideways trend? Or are we standing on the edge of a long-term bear market and the worst is yet to come?
Short-term holders in extreme loss
The STH P/L Ratio measures the supply of short-term holders (STH) in profit versus the supply of short-term holders in loss. If its value is 1, the balance of profit and loss of short-term holders is 0. This means that outputs with a lifespan of less than 155 days globally have no loss or profit (break even).
Like SOPR, it detects local lows in bull markets and local peaks in bear markets. In other words, if it falls to level 1 during a bull market, it is a good buy signal. Conversely, if it rises to level 1 during a bear market, it is a good sell signal.
In addition, it has been helpful in determining absolute lows and peaks in successive market cycles when its readings have deviated extremely from 1. However, here the extremes above 1 were reached months before the historical ATHs. In contrast, extremes below 1 usually required two or three visits to minimum levels before an absolute low was reached.
This latter relationship was well illustrated by on-chain analyst @SwellCycle, who tweeted a chart of the 7-day exponential moving average (EMA) for the STH P/L Ratio just after BTC fell near the $30,000 level. On the chart, he marked with two colors the periods when the indicator reached bottom and linked them to the BTC price (yellow and red area):
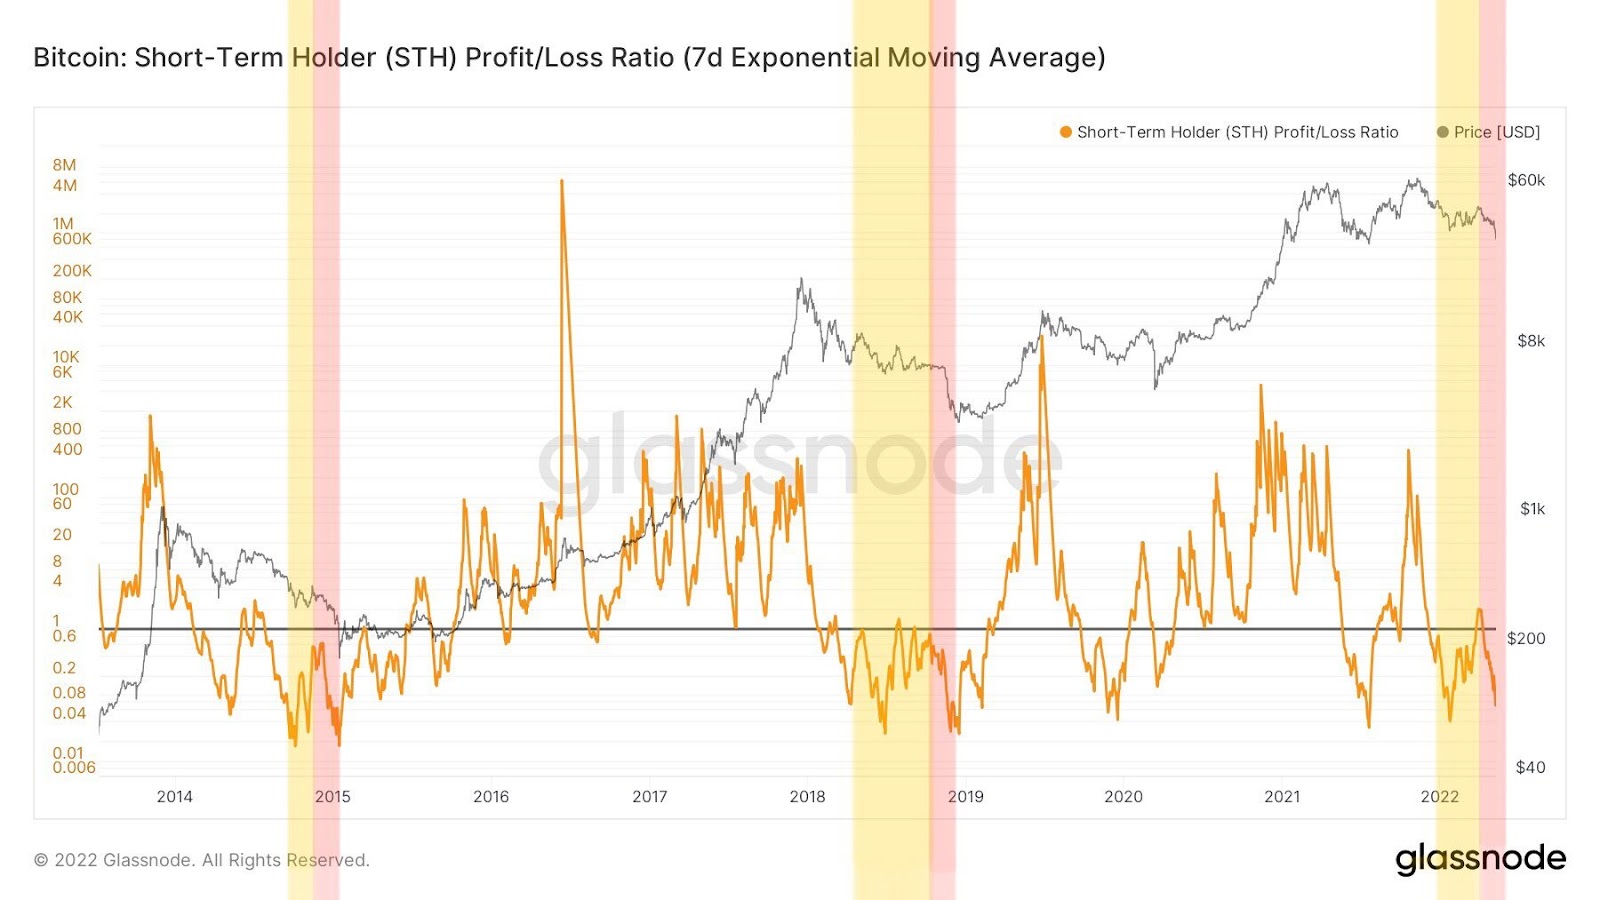
If his interpretation is accurate, then Bitcoin is in search of an absolute bottom (red area). This bottom could be below the summer lows of 2021 when BTC reached $29,000.
Another dive below $30,000?
A different chart shows the same STH P/L Ratio with local lows marked and the corresponding BTC price (green, vertical lines). It appears that the absolute lows of the BTC price were accompanied by a bullish divergence on our indicator. Despite the lower Bitcoin price, the STH P/L Ratio recorded slightly higher values in 2014-2015 and 2018-2019.

If such a situation were to occur again, another deeper dive in the BTC price below $30,000 would be necessary, coupled with a higher low on the short-term holders’ supply ratio indicator.
The related indicator of Total Supply in Profit by STH, provides a similar interpretation. In the course of generating historical lows in the BTC price, this indicator has seen deepening and short-term declines towards the 0 level.
The most dramatic such decline occurred during the crash at the beginning of the COVID-19 pandemic. At that time, the indicator was just over 0.1 BTC. In other words, virtually no Bitcoin in the hands of short-term holders was in profit.
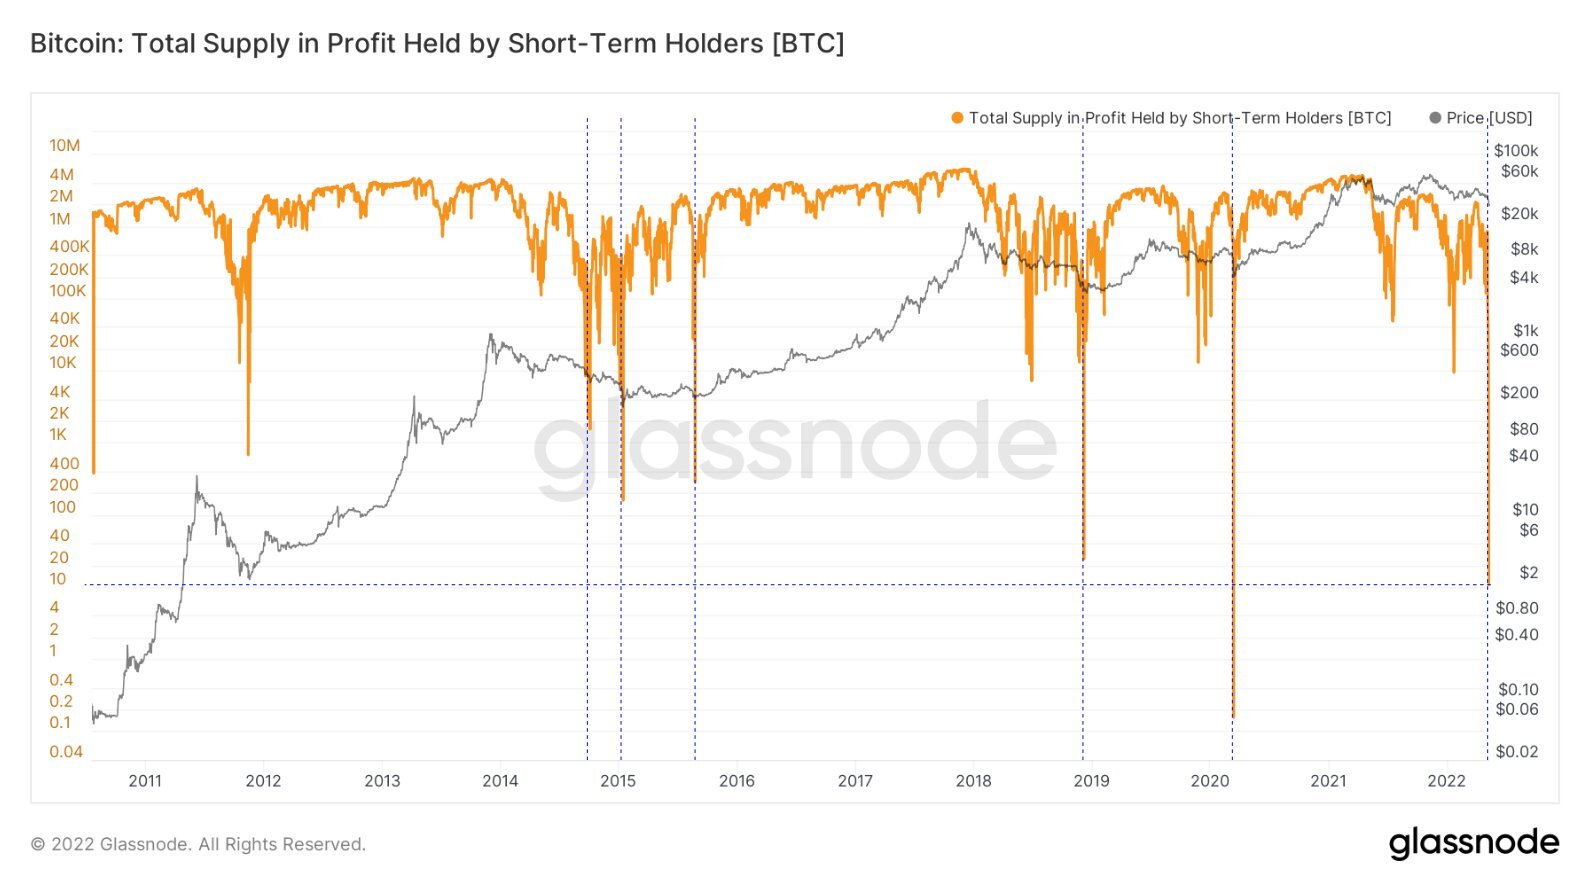
Interestingly, the second lowest value in the history of this indicator was only just reached on May 9, 2022. On the day of Bitcoin’s most recent crash and generating a bottom at the $30,000 level, only 10 Bitcoins of the global supply in STH hands were in profit.
Will LTH join the bear market?
Extreme losses and suffering of short-term holders are quite common during downtrends. Those latest to join the market during uptrends are most often quickly underwater.
Historically, however, it has been the position of long-term holders that has determined the start of a long-term bear market or bounce towards new highs. As long as LTH did not sell at a loss, there was no threat of BTC’s ultimate capitulation. However, the moment LTH lost faith in further gains, Bitcoin was inevitably heading towards an absolute bottom.
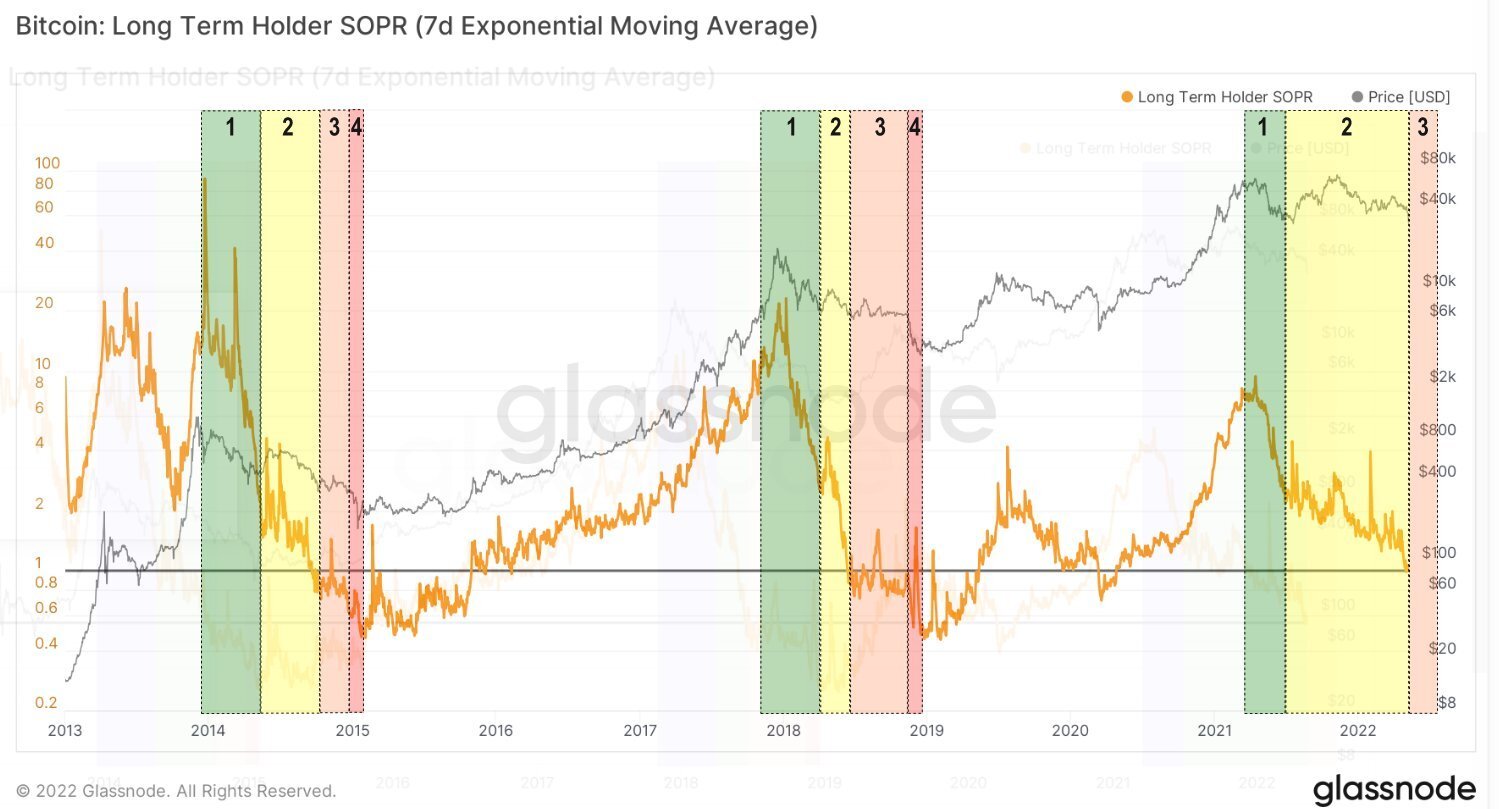
An indicator that helps estimate this is the Spent Output Profit Ratio (SOPR) of long-term holders. The SOPR itself is calculated by dividing the realized value (in USD) by the value at creation (in USD) of a spent output. In other words: price sold / price paid. In contrast, the SOPR for LTH is calculated identically, but considering only outputs with a lifespan greater than 155 days.
The aforementioned analyst @SwellCycle also subjected the long-term chart of the 7-day EMA of the SOPR indicator for LTH to interpretation. First of all, we see a breakdown into 4 bear market phases. Phases 1 and 2 mark relatively mild declines when LTH’s SOPR is still above 1. Phases 3 and 4, on the other hand, mark dynamic and rapid declines towards the absolute bottom reached in the shortest phase 4.
A repeat of the COVID-19 crash?
Importantly, we can see that currently, the chart of the 7-day EMA for SOPR LTH is in a critical position exactly at the level of 1. If this area is lost, we should expect the start of phase 3. However, if it were defended, then perhaps Bitcoin would avoid a long-term bear market.
Furthermore, a March 2020 scenario is possible. At that time, the short-term decline of level 1 was quickly rebounded and the BTC price saw a V-shaped recovery and the uptrend continued.
Regardless of the implications of these on-chain indicators for the BTC price, the market has certainly come to a pivotal moment. The coming weeks will determine whether long-term holders have begun to capitulate and we are in for a cryptocurrency winter. Or will the extreme losses of short-term holders be enough to initiate a trend reversal and a resumption of the bull market?
For BeInCrypto’s latest Bitcoin (BTC) analysis, click here.
Disclaimer
All the information contained on our website is published in good faith and for general information purposes only. Any action the reader takes upon the information found on our website is strictly at their own risk.
Leave a Reply