

The Bitcoin long-term holder SOPR may suggest that the crypto has still only gone one-third of the way through the latest bear market.
Bitcoin 20-day SMA Long-Term Holder SOPR Has Only Been 86 Days Into Bottoming Zone
As pointed out by an analyst in a CryptoQuant post, the crypto is still only 1/3rd of the way into the 260 days average historical bottoming period.
The relevant indicator here is the “Spent Output Profit Ratio” (or SOPR in brief), which tells us about whether the average Bitcoin investor is selling at a profit or at a loss right now.
The metric works by looking at the history of each coin being sold on the chain to see what price it was last moved at. If this previous selling price was less than the latest BTC value, then the coin has just been sold at a profit. While if the last value was more than the current one, then that particular coin realized some loss.
When the value of the SOPR is greater than one, it means the market as a whole is selling at a profit right now.
On the other hand, the indicator being less than one implies the average holder is moving coins at a loss at the moment.
The “long-term holders” (LTHs) is the Bitcoin cohort that includes all investors who have held onto their coins for at least 155 days without selling or moving them.
Now, here is a chart that shows the trend in the BTC SOPR (20-day MA) specifically for these LTHs over the the last several years:
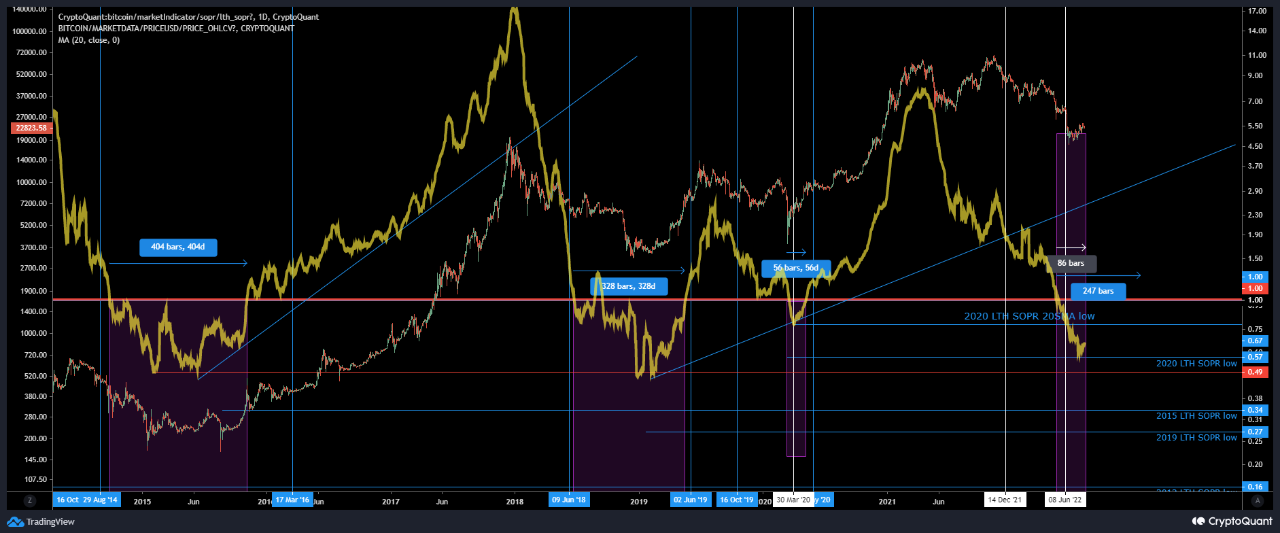
Looks like the value of the metric has been pretty low recently | Source: CryptoQuant
As you can see in the above graph, the Bitcoin LTH SOPR (20-day SMA) dipped below the “one” mark a while back.
Also, in the chart the quant has marked all the relevant zones of trend for the indicator in relation to the bear market.
It seems like historical bottoming periods have lasted whenever the metric has been stuck below the breakeven point.
On average, past bear markets have lasted around 260 days based on the LTH SOPR. In the current cycle, the coin has so far been 86 days into the bottoming zone.
This would suggest that if Bitcoin ends this bear market in about the same time as the average, then the crypto is still only one-third of the way through.
BTC Price
At the time of writing, Bitcoin’s price floats around $23k, down 2% in the last week. Over the past month, the coin has gained 13% in value.

The value of the crypto seems to have been moving sideways during the last few days | Source: BTCUSD on TradingView
Featured image from mana5280 on Unsplash.com, charts from TradingView.com, CryptoQuant.com
Leave a Reply