

Data shows the Bitcoin miner reserves have continued to trend downwards recently, suggesting that miners have been dumping their coins.
Bitcoin Miners Have Been Withdrawing From Their Wallets In Recent Days
As pointed out by an analyst in a CryptoQuant post, BTC miner reserves have been observing negative change recently, something that could lead to a decline in the price of the crypto.
The “miner reserves” is an indicator that measures the total amount of Bitcoin currently present in the wallets of all miners.
When the value of this metric goes up, it means miners are depositing more coins into their wallets right now. Such a trend, when prolonged, can be bullish for the value of BTC as it can be a sign of accumulation from these network validators.
On the other hand, a decline in the indicator implies miners are transferring coins out of their reserves at the moment. Since miners usually take out their BTC for selling purposes, this kind of trend can prove to be bearish for the crypto.
Now, here is a chart that shows the trend in the Bitcoin miner netflows, a metric that records the percentage changes in the total miner reserves, over the last few months:
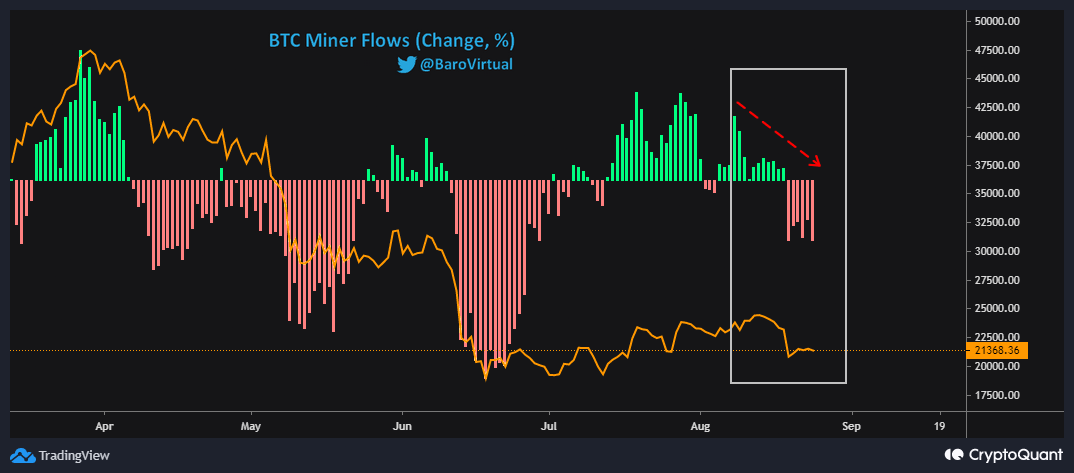
Looks like the indicator has noticed negative changes in recent days | Source: CryptoQuant
Negative miner netflows suggest the reserves are going down, while positive values mean they are registering an increase.
As you can see in the above graph, the value of this BTC indicator had been above zero earlier in the month, but recently it has been underwater.
This could hint that these miners have been dumping in recent days. As is apparent from the chart, whenever the reserve has seen negative changes in the last few months, the BTC price has taken a hit.
This time as well the value of Bitcoin has recorded a decline while these latest red values of the miner reserve have persisted. It’s possible that if miners continue their trend of dumping, then the crypto may observe further drawdown, at least in the short term.
BTC Price
At the time of writing, Bitcoin’s price floats around $21.4k, down 8% in the last seven days. Over the past month, the crypto has lost 4% in value.
The below chart shows the trend in the price of the coin over the last five days.

The value of the crypto has been mostly moving sideways in the last few days since the plunge | Source: BTCUSD on TradingView
Featured image from Joshua J. Cotten on Unsplash.com, charts from TradingView.com, CryptoQuant.com
Leave a Reply