

The Federal Open Market Committee (FOMC) announced a 75 basis points (bps) rate hike on Sept. 21. The Bitcoin (BTC) price fell sharply as a result.
The FOMC began a two-day meeting on Sept. 20, in order to discuss how to tackle the issue of inflation. So far, the FOMC has raised federal fund rates by 25 basis points (bps) in March 2022, by 50 bps in May, and finally by 75 bps in June.
After the meeting came to an end, the FOMC raised the target rate by 75 bps, bringing it to a range of 3.00-3.25%. Additionally, it signaled future increases, and projections are showing a rise to 4.40% by the end of the year and 4.60% in 2023.
On top of this, the president of Russia, Vladimir Putin announced a partial military mobilization on Wednesday, in what is seen as an escalation of the ongoing invasion of Ukraine. Putin stated that “mobilization” would start on Wednesday and that he had increased funding for Russia’s weapons production.
BTC creates bullish hammer
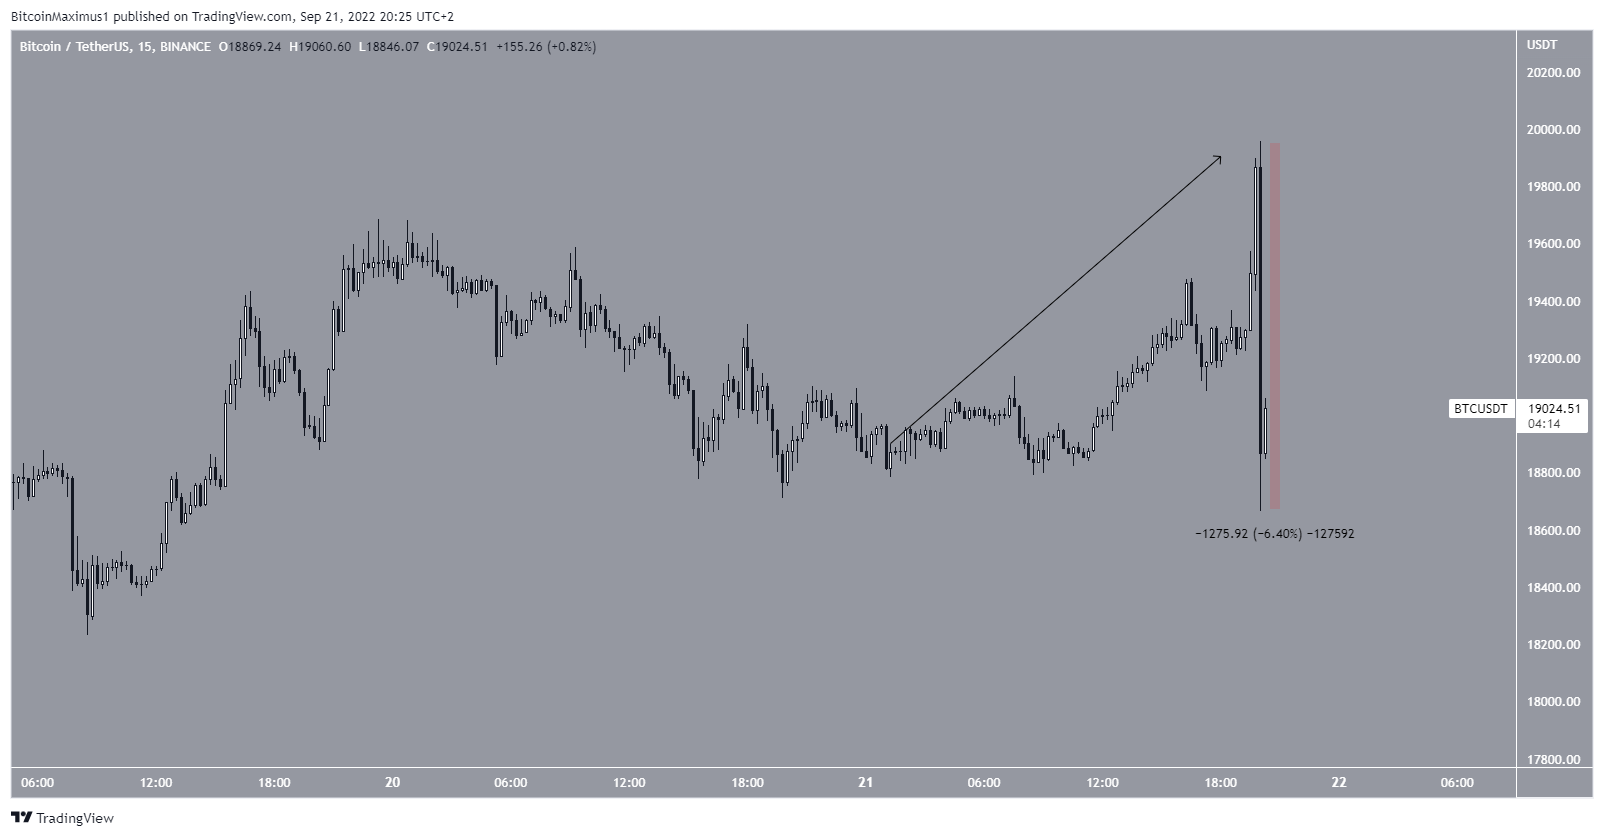
BTC had been increasing on Sept. 21, gradually moving upwards from a low of $19,000. The move accelerated going into the FOMC announcement, culminating with a high of $19,956.
However, after 75 bps announcement, the price fell sharply, decreasing by 6.40% in a matter of minutes. This created a large bearish candlestick and led to a low of $18,666 before a slight bounce.
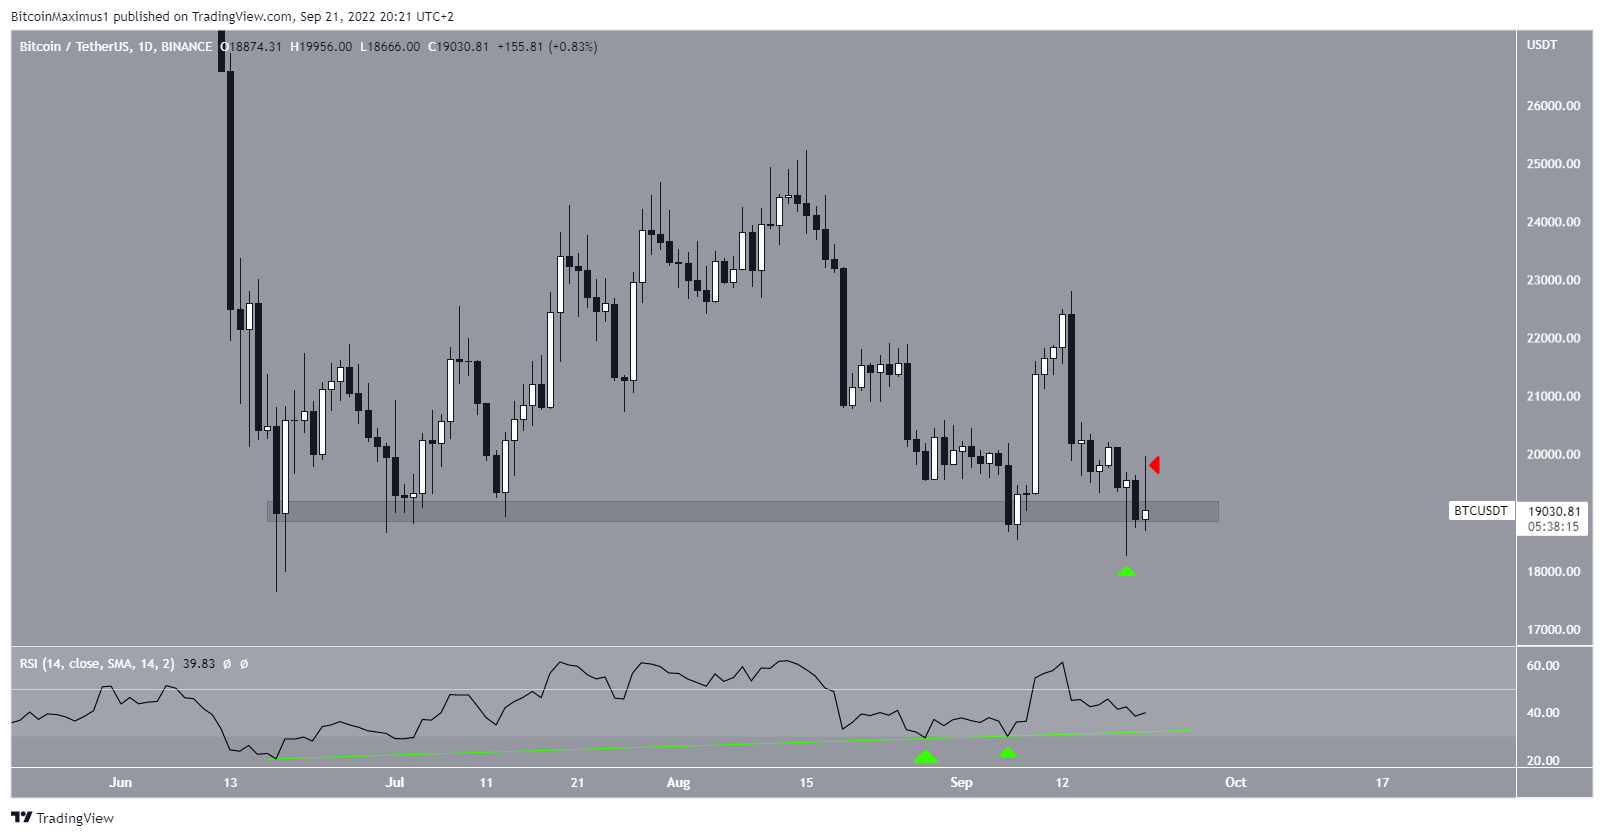
Despite the sharp fall, the daily chart shows that BTC is trading inside the $19,000 horizontal support area, which has been in place since June. The price bounced sharply on Sept. 19, creating a bullish hammer candlestick (green icon) in the process. This is a type of bullish candlestick which is shows buying pressure due to the creation of a long lower wick. The candle also validated the $19,000 area as support.
The daily RSI is still bullish. It has been generating bullish divergence since the June lows and its bullish divergence trendline is still intact (green line). As long as it is and the price does not close below the $19,000 area, the bullish structure remains valid.
However, it is worth noting that despite the lack of a daily close below this area, the daily candlestick is shaping up to be bearish, with a long upper wick (red icon), which is considered a sign of selling pressure.
For Be[In]Crypto’s latest Bitcoin (BTC) analysis, click here
Disclaimer
All the information contained on our website is published in good faith and for general information purposes only. Any action the reader takes upon the information found on our website is strictly at their own risk.
Leave a Reply