

Unlike Bitcoin, XRP, Dogecoin, and a few other top cryptocurrencies, Ether (ETH) have been unable to generate short-term gains over the last few days. ETH’s price has battled the $1350 resistance for over two weeks now.
Bitcoin charted some humpday gains, as BTC price finally established above the $20,000 psychological resistance. The mid-week BTC gains fueled short-term upticks for altcoins, however, ETH price failed to recover from the rangebound momentum.
As ETH bulls await a much-needed breakout, here’s how Ether’s technicals and on-chain indicators would govern the same.
ETH price still consolidating
At press time, Ether traded at $1,334.11 noting a 1.35% drop in the daily time frame. ETH’s price has consolidated in a tight band between the $1280 and $1350 mark since Sept 22.
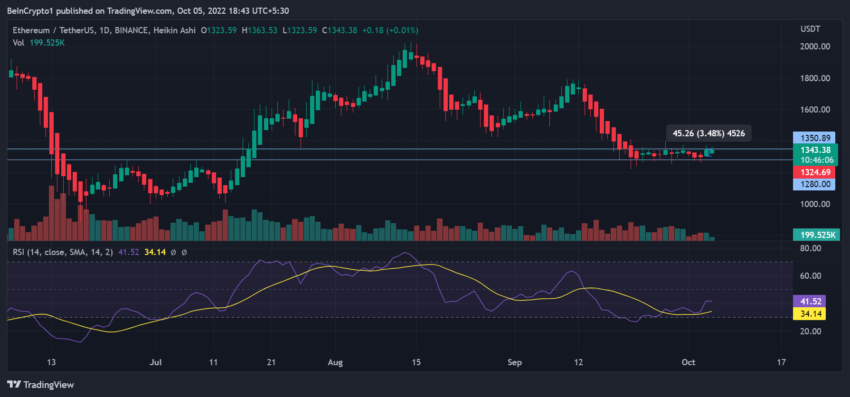
Early in the week, ETH’s price gained around 3.5% from the lower bound of $1280 but it still faces stiff resistance at the $1350 mark. While there was a slight rise in RSI indicating buyers gaining ground, RSI plateaued on Wednesday with fading momentum.
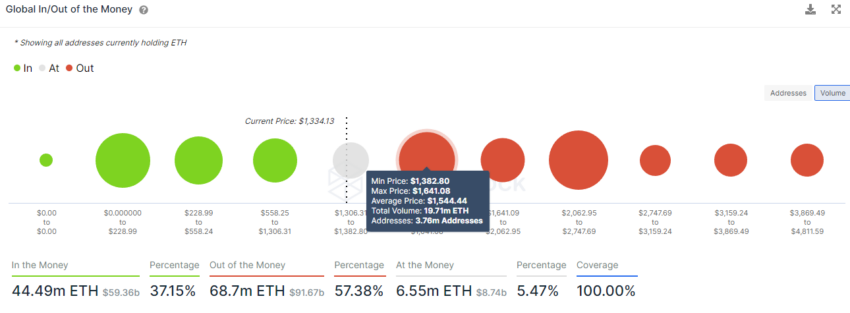
As per the Global In and Out of Money indicator, the next significant resistance for ETH was at the $1544 mark where 3.76 million addresses held over 19.71 million ETH.
That said, recently, Fidelity announced that its new Ethereum Index Fund will offer clients access to ETH. In tandem with the announcement, a slight uptick in ETH’s large transactions was witnessed which presented an increasing interest from institutions over the last few days.
Nonetheless, this wasn’t enough to fuel gains for Ether as on-chain metrics presented another picture.
On-chain indicators favoring bears
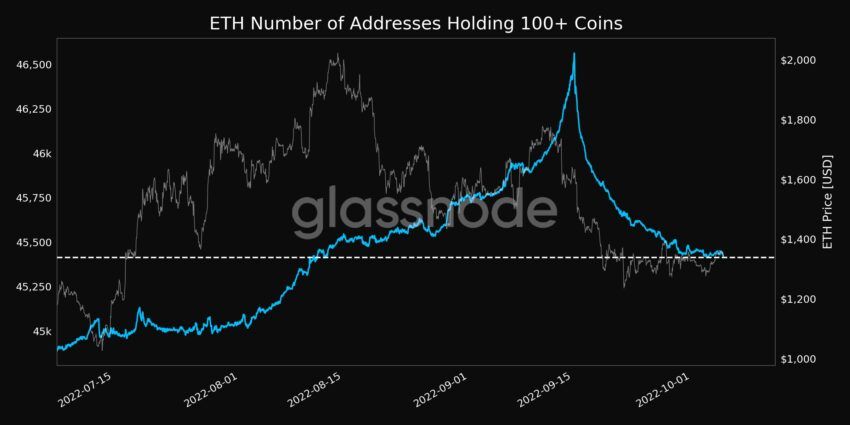
The number of addresses holding 100+ Ether reached a 1-month low of 45,414 on Oct. 5 according to data from Glassnode Alerts. A sustained drop in addresses holding 100+ coins presented dwindling confidence from whales over the last month.
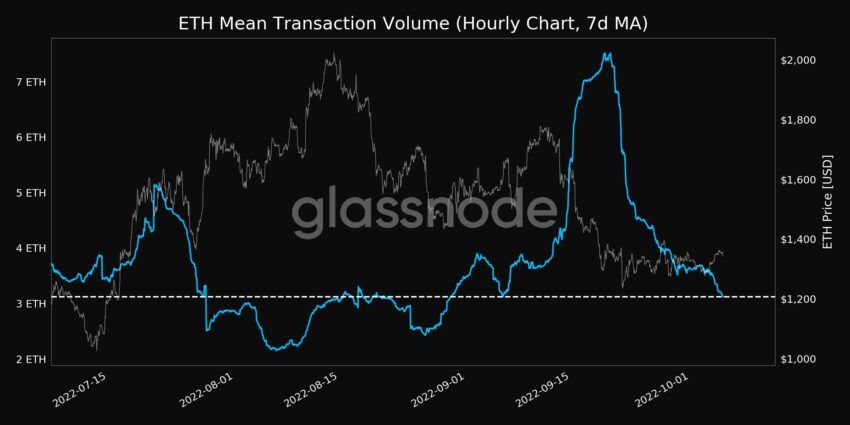
Additionally, Ether’s mean transaction volume (7d MA) made a 1-month low of 3.121 ETH further highlighting a less vibrant network. The dwindling transaction volumes also present how the market continues to remain skeptical as price consolidates and macroeconomic conditions remain unsure.
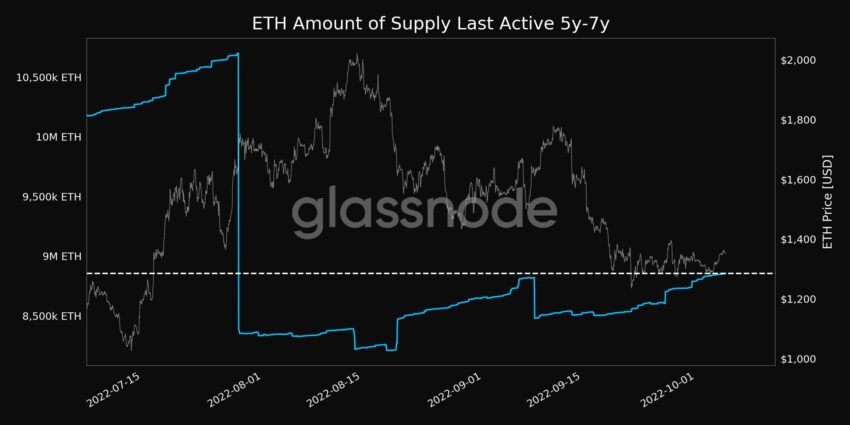
Ethereum’s amount of supply last Active 5y-7y reached a 1-month high of 8,855,342.913 ETH signifying that some long-term holders might be looking to make a move in the market which can in turn affect prices.
Lastly, ETH NVT Ratio (7d MA) made a 2-year high of 3,154.557 presenting large bearish over-extensions in price action, which signals massive divergence between value and utility.
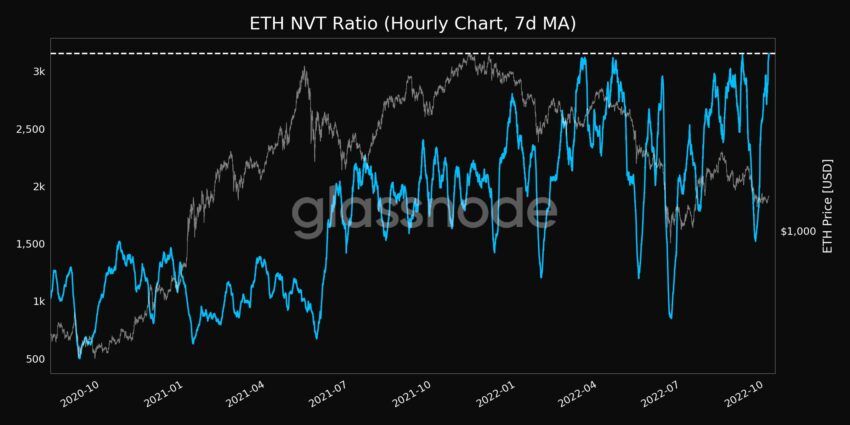
Historically, NVT reaching such high values is followed by a drop in price. As per IOMP indicator if another ETH pullback takes place the next significant support would be at the $900 mark.
For Be[In]Crypto’s latest Bitcoin (BTC) analysis, click here
Disclaimer: The information provided in independent research represents the author’s view and does not constitute investment, trading, or financial advice. BeinCrypto doesn’t recommend buying, selling, trading, holding, or investing in any cryptocurrencies
Disclaimer
All the information contained on our website is published in good faith and for general information purposes only. Any action the reader takes upon the information found on our website is strictly at their own risk.
Leave a Reply