

Despite the bearish price action, the Polkadot (DOT) network continues to grow rapidly. Today, data was published on staking improvements and the so-called Nakamoto coefficient. The latter measures the level of blockchain decentralization, which remains higher in Polkadot than in Ethereum (ETH), BNB Smart Chain (BNB), or Cardano (ADA).
Unfortunately, despite the high performance and development of the network, DOT’s price action is bearish and approaching historic lows recently. Kusama (KSM), which is an experimental network for Polkadot developers and innovators, is trading similarly. However, in both cases, bullish formations have appeared on the charts, which may soon lead to a resumption of the uptrend.
Polkadot reaches support at $6
Polkadot (DOT) has been in a downtrend since reaching the all-time high (ATH) at $55 on November 4, 2021. So far, the altcoin has reached a low of $5.97 on September 21, 2022. This represents a decline of 89% from the ATH.
At the end of April 2022, Polkadot lost its long-term support line (black), which had been in place since December 2020. The multi-week breakdown led to a historical area just below $6 (red), which served as resistance (blue arrows) after the network’s launch in 2020. Currently, this level is expected to provide support and help initiate a bounce. If this does not happen, and the broad cryptocurrency market continues to bleed, DOT could soon reach new lows.

On the daily chart, we observe a descending parallel channel pattern, which has been in place since mid-May 2022 declines. In June, Polkadot lost the median of the channel and recorded lows near the channel’s lower edge and the support area at $6. In late July, the price reclaimed the median of the pattern and is currently trading above it.
Descending parallel channels usually contain corrective movements, so there is a higher probability of breaking out of it than breaking down. The declining volume suggests that a major move on the DOT chart is imminent.
However, price action has been showing weakness recently, and DOT is again trading near the aforementioned support at $6. Currently, the area is near the median of the channel.
If the median and support are lost, Polkadot could be heading for the all-time low (ATL) near $3. If, on the other hand, increases occur, the first resistance will be the upper edge of the channel near $8. The next resistance is the $10 level, correlating with the local peak and the 0.382 Fib retracement measured for the last decline.

A descending wedge on the Kusama chart
Kusama is a software experimentation network for developers who want to innovate or prepare implementations for Polkadot. Both networks are built using the same language and similar code. Despite this, they remain independent and have different priorities.
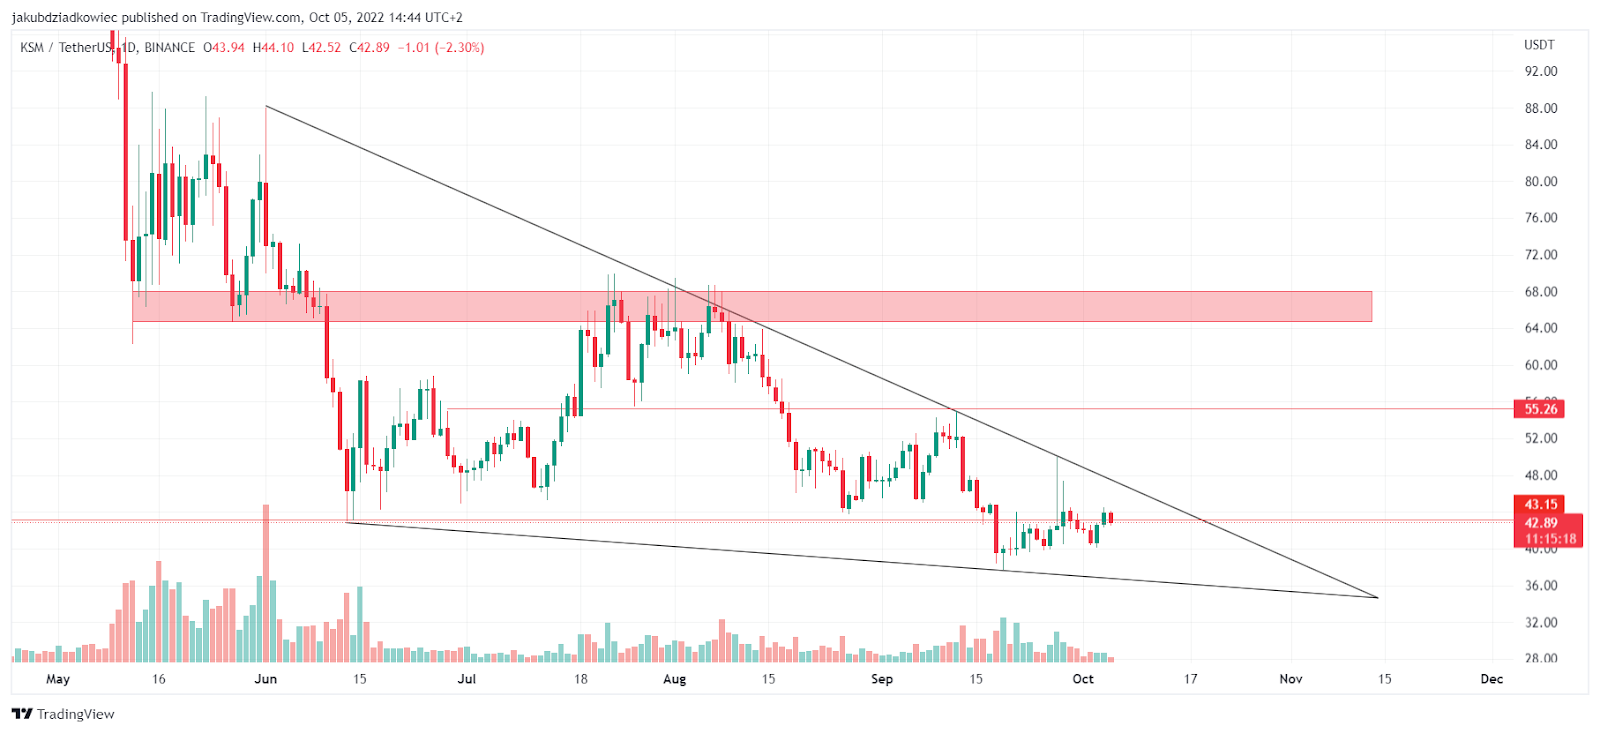
The price action of KSM, the token of the Kusama network, looks similar to the DOT chart. The difference, however, is that here the price has already fallen below the long-term support at $43.15. Moreover, the price is moving in a descending wedge pattern.
Currently, Kusama is trying to regain this support, while approaching the end of the wedge. If a breakout occurs, the next resistance/support level will be at $55.25, followed by the previous peak in the $65-68 range. Here, too, the low volume could be an indicator of an imminent move.
Polkadot decentralization and Nakamoto Coefficient
Despite weak DOT and KSM price action, the Polkadot network is growing rapidly and remains a leader in decentralization in the crypto sector. A bi-monthly report on the new features of the staking desktop was recently published.
Readability and access to the nominator pool have been improved. These are units in the network that generate rewards in each era and then distribute them proportionally among members. Later, rewards from staking can be withdrawn or added back to the nominator pool.
In addition, user @theEarly3IRD pointed out today that Polkadot remains the leader of smart contract platforms in terms of decentralization. One of its measures is the so-called Nakamoto Coefficient. It is a numerical measure of the level of decentralization of a blockchain or other decentralized system.
The Nakamoto Coefficient measures the number of nodes (entities) required to compromise at least one significant subsystem of the network. The higher this ratio is relative to the total number of validators, the lower the risk of a collision disrupting a decentralized blockchain.
In the table published today, we see that Polkadot has the highest Nakamoto Coefficient among the most popular blockchains. Its value for Polkadot is 82, while it is 30 for Ethereum, and 7 each for BNB Smart Chain and Cardano.

Such a high coefficient value is possible due to the relatively small number of validators combined with the relatively high security of the network. Among the largest blockchains, only Bitcoin (BTC) has a higher Nakamoto Coefficient, which is as high as 7,349.

For Be[In]Crypto’s latest Bitcoin (BTC) analysis, click here.
Disclaimer
All the information contained on our website is published in good faith and for general information purposes only. Any action the reader takes upon the information found on our website is strictly at their own risk.
Leave a Reply