

Decentraland (MANA) price has broken down below the $0.75 horizontal support area and could continue decreasing towards $0.49. Sandbox (SAND) has fallen to a new yearly low and shows no signs of a potential reversal.
MANA Price Breaks Down Below Crucial Support
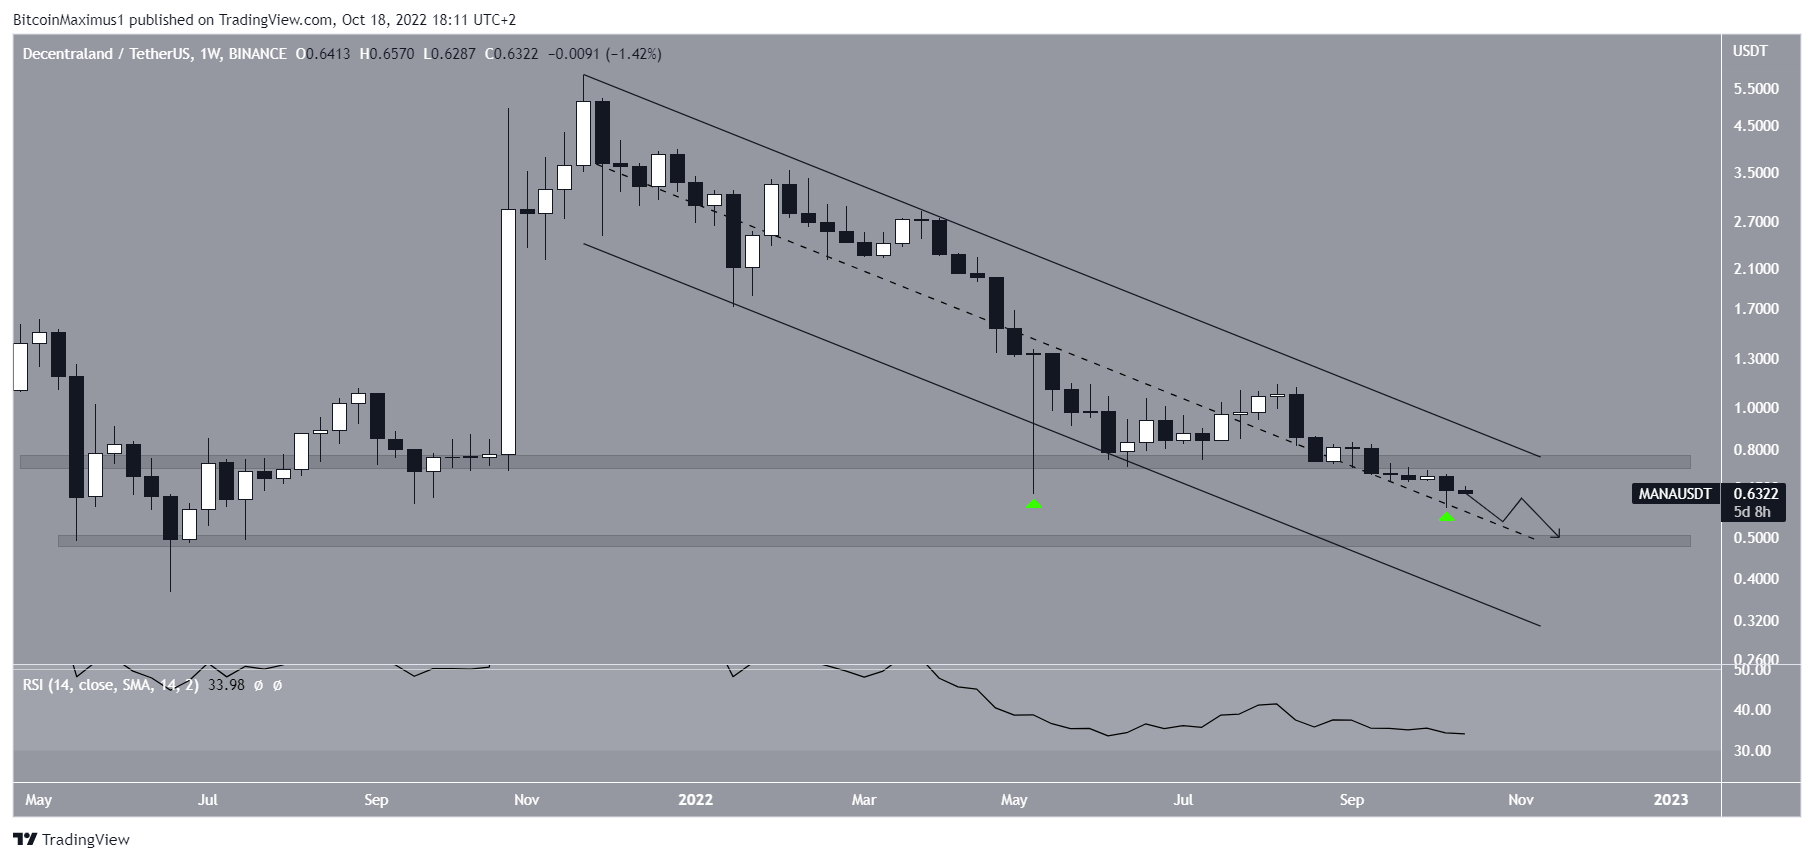
MANA has been falling inside a descending parallel channel since May 2021, when it reached an all-time high price of $5.91.
In May 2022, the MANA price reached a low of $0.62 and bounced, creating a very long lower wick in the process (green icon). Such wicks are considered a sign of buying pressure. At the time, this was seen as a very bullish development, since it saved a potential breakdown and validated both the $).75 support area and the support line of the channel.
However, the breakout could not be sustained, and the MANA price broke down below the area on Sept. 15.
While the price has managed to hold on in the upper portion of the channel, there are no bullish signs in place. On the contrary, the weekly RSI has invalidated its potential bullish divergence and is below 50.
As a result, the price of Decentraland is expected to decrease towards the next closest long-term support area at $0.49. This would also validate the middle of the channel as support once more.
So, the most likely MANA price prediction is bearish.
SAND Falls to New Yearly Low
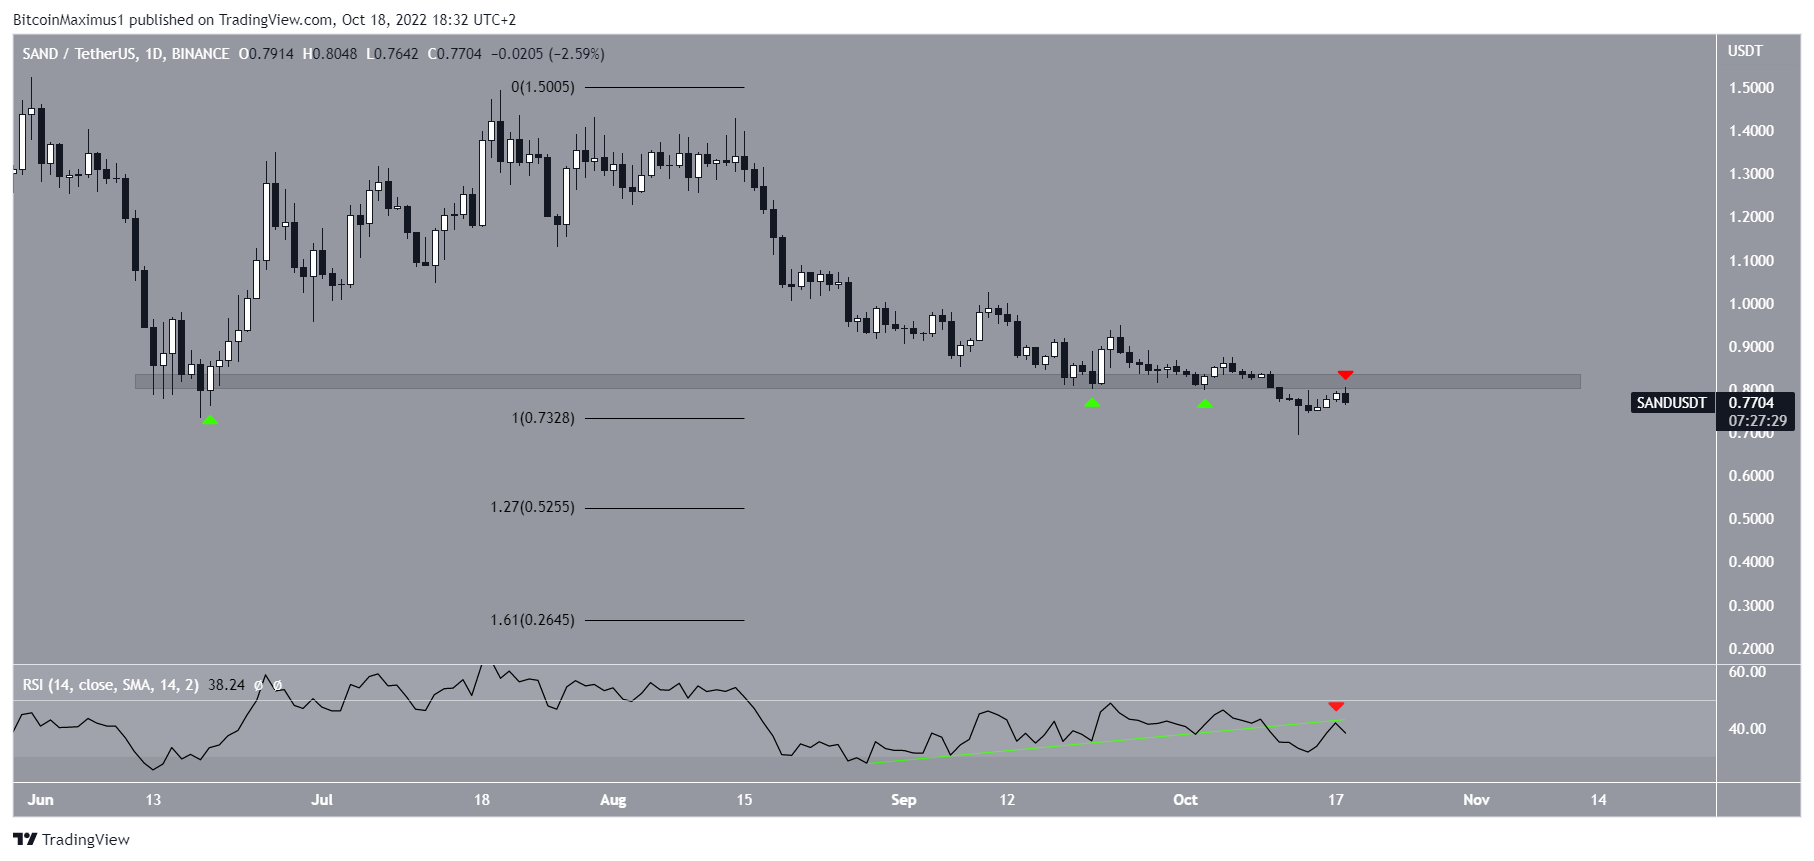
SAND has been falling since reaching a high of $1.49 on July 20. It created a lower high on Aug. 14 and accelerated its rate of decrease afterward.
Initially, the SAND price bounced above the $0.82 horizontal area (green icons). The bounce was crucial since the area had previously acted as the yearly low support.
However, SAND failed to initiate an upward movement and broke down below the area on Oct. 10.
On Oct. 13, SAND fell to a new yearly low of $0.69. While it created a long lower wick afterward and bounced, it failed to reclaim the $0.82 horizontal area. Rather, it was rejected by the area on Oct. 18.
The daily RSI readings are bearish. The indicator has broken down below its bullish divergence trendline (green) and is below 50.
As a result of these bearish technical analysis readings, the most likely price prediction is a continuation of the downward movement.
In this case, the SAND price could fall towards the closest Fib support levels at $0.52 and $0.26.
For BeInCrypto latest Bitcoin (BTC) analysis and crypto market analysis, click here
Disclaimer: BeInCrypto strives to provide accurate and up-to-date information, but it will not be responsible for any missing facts or inaccurate information. You comply and understand that you should use any of this information at your own risk. Cryptocurrencies are highly volatile financial assets, so research and make your own financial decisions.
Disclaimer
All the information contained on our website is published in good faith and for general information purposes only. Any action the reader takes upon the information found on our website is strictly at their own risk.
Leave a Reply