

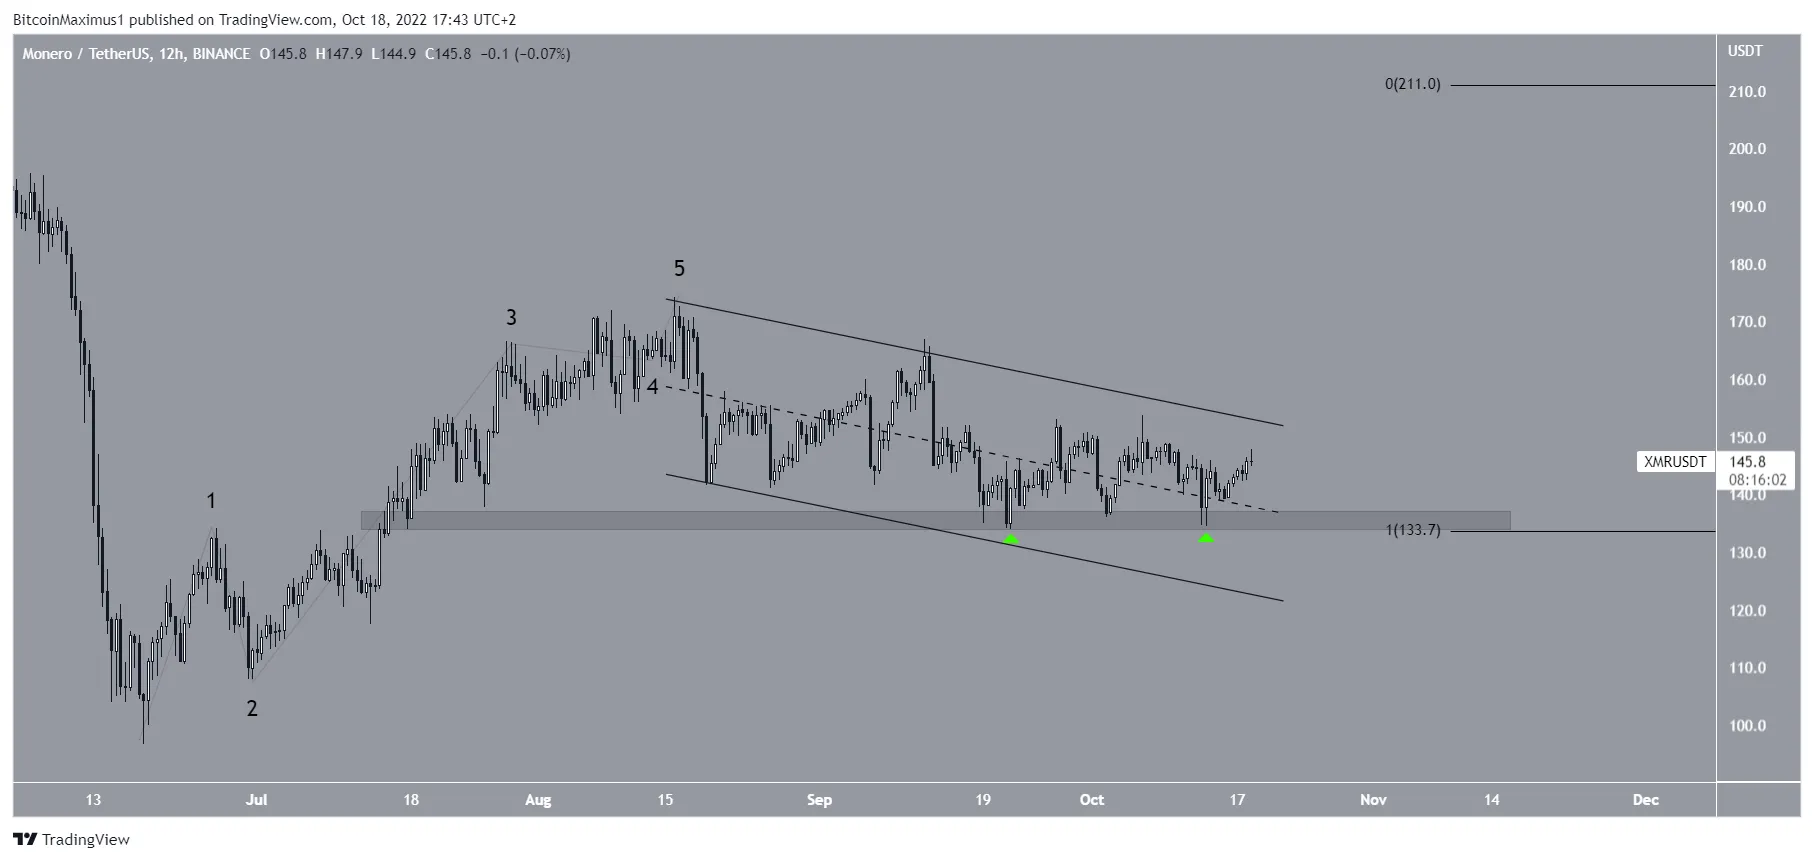
The Monero (XMR) price is expected to break out from its current pattern as long as it stays above the $135.3 support area.
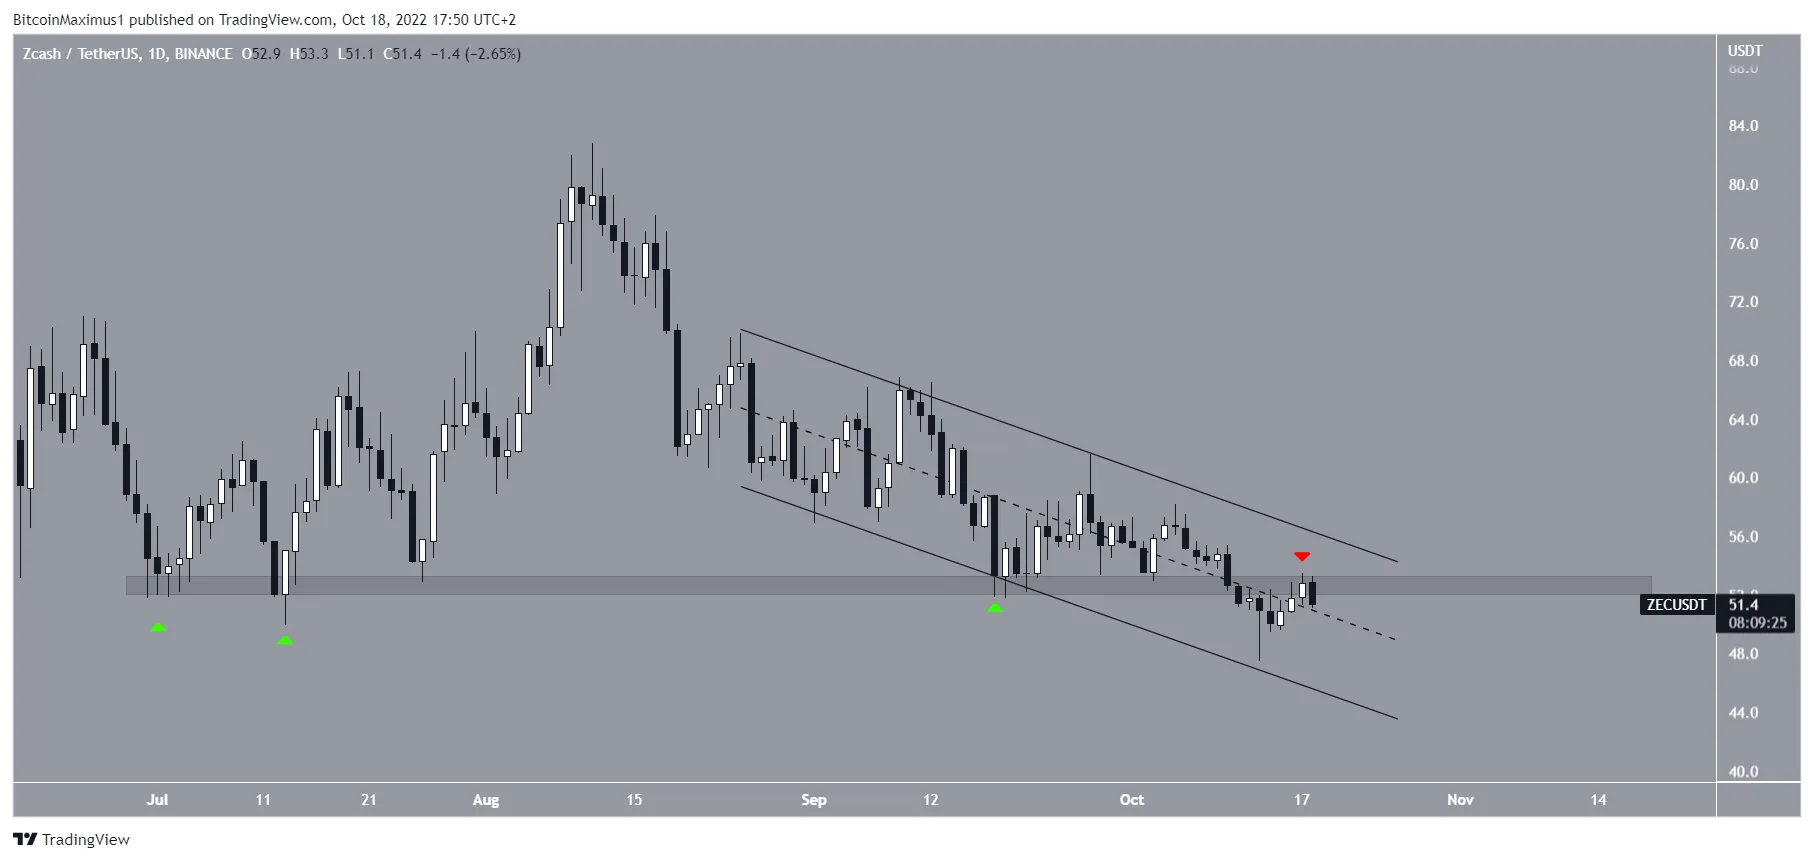
Zcash (ZEC) is also trading inside a descending parallel channel, but its outlook is more bearish due to it trading below the $53 resistance area.
XMR Price Bounce Hints at Breakout
XMR has been decreasing inside a descending parallel channel since reaching a high of $174.2 on Aug. 16. The downward movement has twice (green icons) led to lows near the 0.5 Fib retracement support level at $135.3.
The price has been moving upwards since the second touch on Oct. 14 and is now in the upper portion of the channel. This suggests that an eventual breakout is expected.
Nevertheless, even if the XMR price were to break out below the 0.5 Fib retracement support level, this would likely be a short-term rather than a long-term drop. The Monero price would likely find support at the 0.618 Fib retracement support level at $126.2. The level also coincides with the support line of the channel.

The increase since the June 18 low looks like a completed five-wave upward movement. As a result, it is possible that it is only the first portion of either an A-B-C structure or a new bullish impulse.
In both cases, another upward movement is likely, which would cause a breakout from the channel.
The exact target depends on if the increase is an A-B-C structure or a bullish impulse. Additionally, it depends on whether the current correction is complete.
If it is, the first target given by the price forecast would be at $211, giving both portions of the increase a 1:1 ratio. The target would have to be adjusted if the XMR price falls to a new low.
ZEC Fall to New Yearly Low
In a similar fashion to XMR, the ZEC price has also been falling inside a descending parallel channel. However, the technical analysis for the latter is considerably more bearish.
The main reason for this is that the ZEC price has fallen below the $53 horizontal area. This is a crucial area that had previously acted as the yearly low, thrice initiating a bounce.
Finally, ZEC broke down below it on Oct. 11 and is currently in the process of validating it as resistance (red icon).
Until the ZEC price moves above this area, the trend cannot be considered bullish. In case the rejection is confirmed, another drop towards the support line of the channel at $44 is expected.
For BeInCrypto latest Bitcoin (BTC) analysis and crypto market analysis, click here
Disclaimer: BeInCrypto strives to provide accurate and up-to-date information, but it will not be responsible for any missing facts or inaccurate information. You comply and understand that you should use any of this information at your own risk. Cryptocurrencies are highly volatile financial assets, so research and make your own financial decisions.
Disclaimer
All the information contained on our website is published in good faith and for general information purposes only. Any action the reader takes upon the information found on our website is strictly at their own risk.
Leave a Reply