

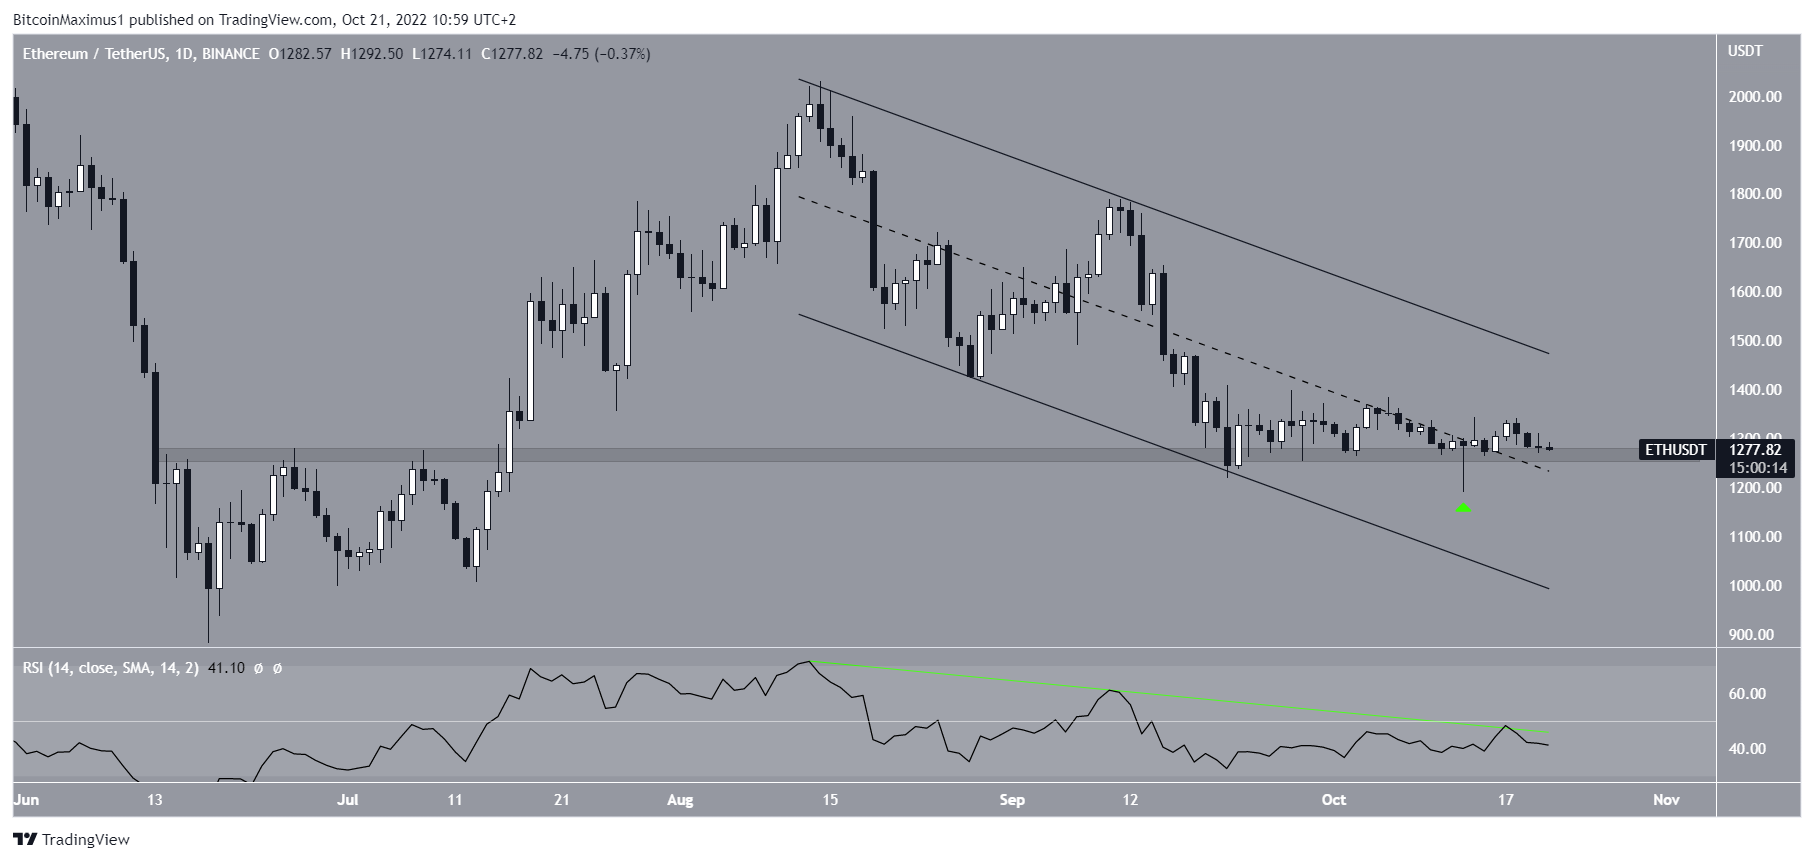
Ethereum (ETH) price has managed to hold on above the $1,270 horizontal support area. A breakdown from it could lead to much lower prices.
ETH price has been decreasing inside a descending parallel channel since reaching a high of $2,030 on Aug. 14. Such channels usually contain corrective movements, meaning that an eventual breakout from it would be expected. Ethereum price fell to a low of $1,190 on Oct. 13 before bouncing.
The bounce was crucial for several reasons. Firstly, it created a long lower wick (green icon), which is considered a sign of buying pressure.
Secondly, it validated the $1,270 horizontal area as support. The area had previously acted as resistance in July and has now turned to support. Finally, it caused ETH price to move in the upper portion of the channel.
It is worth mentioning that the daily RSI is still following its descending resistance line (green) and is below 50. A breakout from both is required in order for the trend to be considered bullish.
Ethereum Price Prediction: Wave Count Support Breakout
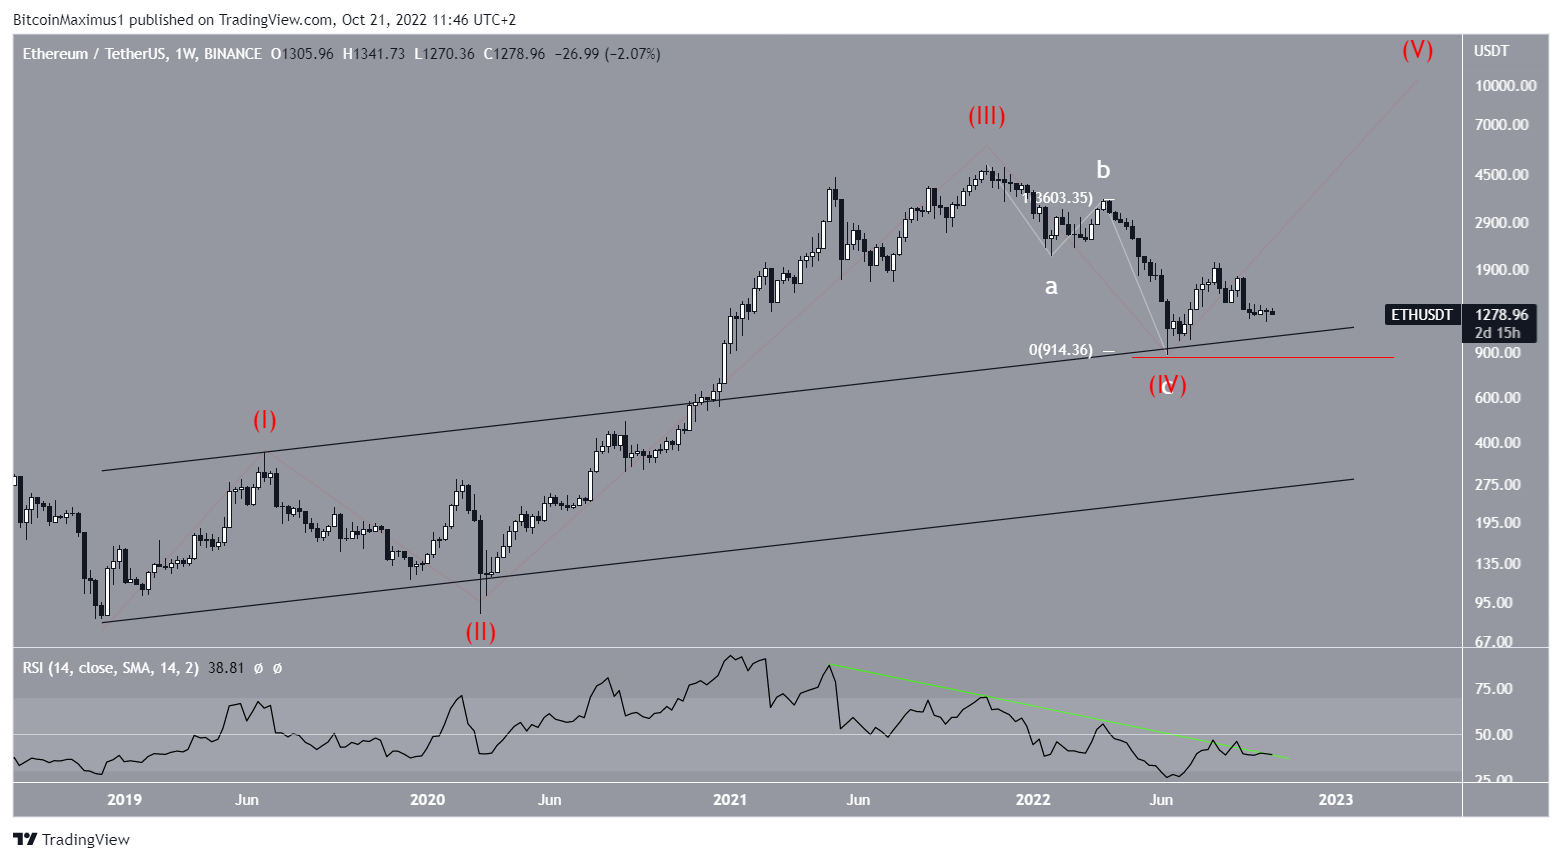
While there are mixed signs in the price forecast from the daily timeframe, the weekly timeframe is bullish.
The most likely wave count suggests that Ethereum price has begun the fifth and final wave of a bullish impulse (red). If correct, the ensuing upward movement would lead to a new all-time high.
There are two main factors that support the validity of the count. ETH price has seemingly completed a fourth wave pullback, and sub-waves A:C have had an exactly 1:1 ratio (white).
However, similarly to the daily timeframe, the weekly RSI has not broken out from its bearish divergence trendline (green) and is still below 50. A breakout from both is required for the trend to be confirmed as bullish.
A decrease below the yearly low of $881.56 would suggest that the price action is bearish instead.
ETH Price Can Outperform BTC
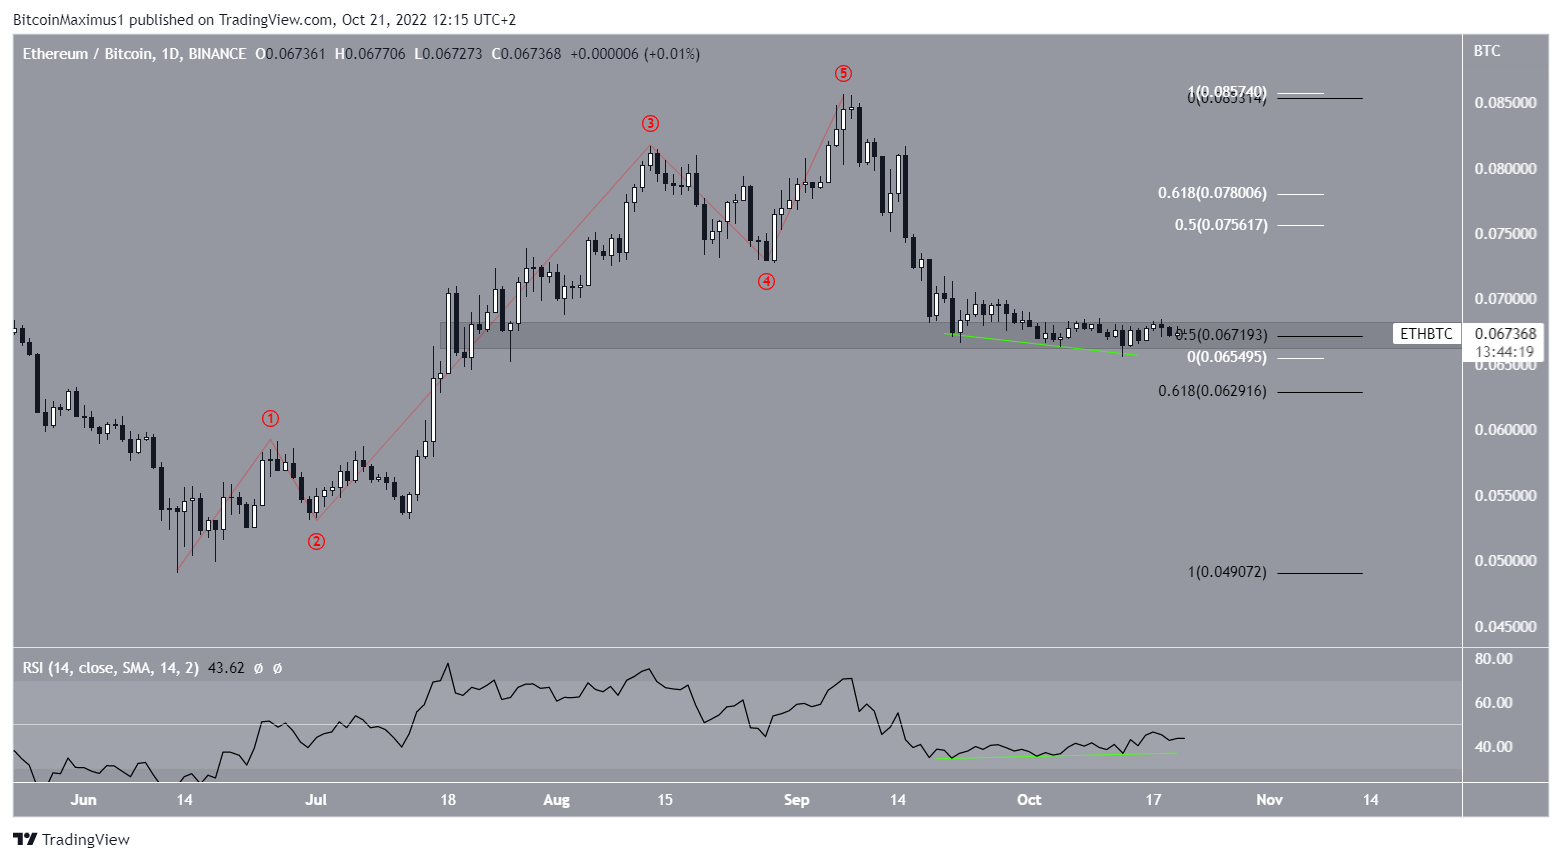
The ETH/BTC pair also provides a bullish outlook, suggesting that the Ethereum price is expected to outperform that of Bitcoin (BTC).
While the ETH price has been falling since completing a five-wave upward movement on Sept. 7, it has temporarily halted its drop. Ethereum price has bounced at a confluence of both Fib and horizontal support levels at ₿0.067. Moreover, the daily RSI has generated a significant amount of bullish divergence.
These signs indicate that an upward movement is expected. If one occurs, the main resistance area would be between ₿0.075-₿0.078. The area is created by the 0.5-0.618 Fib retracement resistance levels.
A price decrease below the ₿0.065 low would invalidate the bullish ETH price prediction.
For the latest BeInCrypto Bitcoin (BTC) and crypto market analysis, click here
Disclaimer: BeInCrypto strives to provide accurate and up-to-date information, but it will not be responsible for any missing facts or inaccurate information. You comply and understand that you should use any of this information at your own risk. Cryptocurrencies are highly volatile financial assets, so research and make your own financial decisions.
Disclaimer
All the information contained on our website is published in good faith and for general information purposes only. Any action the reader takes upon the information found on our website is strictly at their own risk.
Leave a Reply