

The Cardano (ADA) price is trading inside an important horizontal support area, but has yet to show any bullish reversal signs whatsoever.
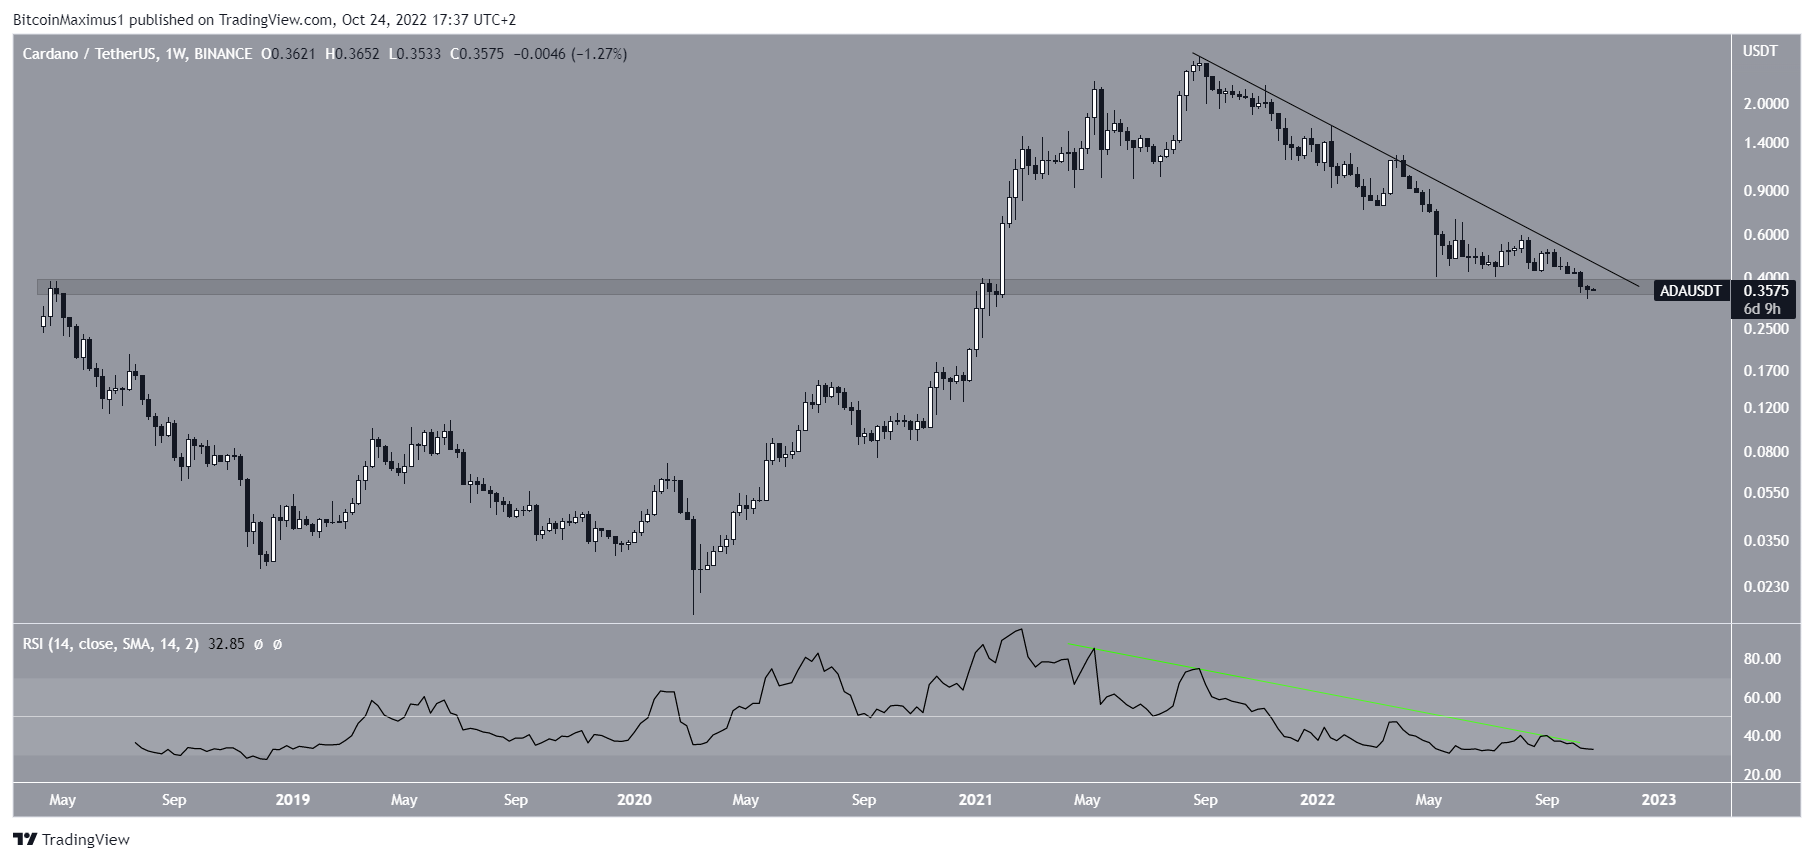
The Cardano price has decreased underneath a descending resistance line since Aug. 2021. So far, the decrease has led to a low of $0.33 on Oct. 21.
The low was made inside the $0.36 horizontal support area. This is a crucial horizontal level since it has acted as resistance in both May 2018 and Feb. 2021. After the ADA price broke out, it initiated a rapid upward movement that led to the $3.10 all-time high.
There are no bullish reversal signs in place yet. The weekly RSI is still decreasing below a descending resistance line (green) and has not generated any bullish divergence. Furthermore, the ADA price has yet to break out from its descending resistance line.
Currently, whether ADA manages to break out from the line or instead breaks down below the $0.36 support area could determine the direction of the future trend.
ADA Price Could Bottom at $0.32
A closer look at the daily price action shows that the ADA price has broken down from a symmetrical triangle. It did so on Oct. 2, confirming the beginning of a new five-wave downward movement (black).
On Oct. 23, the CEO of FTX, Sam Bankman-Fried tweeted that the exchange plans on listing ADA in the future. Currently, ADA is not listed in the spot exchange but is listed in the futures one. The price initiated an upward movement shortly afterward.
However, it is possible that the move was part of the count. If the count is correct, the Cardano price is currently retracing in what is likely wave four. Therefore, another final downward movement will follow afterward which will lead to the bottom.
The closest Fib target for this bottom is at $0.33, created by the 1.27 external Fib retracement of the triangle.
If not, the next Fib support area would be at $0.23. While this would fit better with the breakdown from the long-term $0.36 area, it would mean that wave five would be extremely extended.
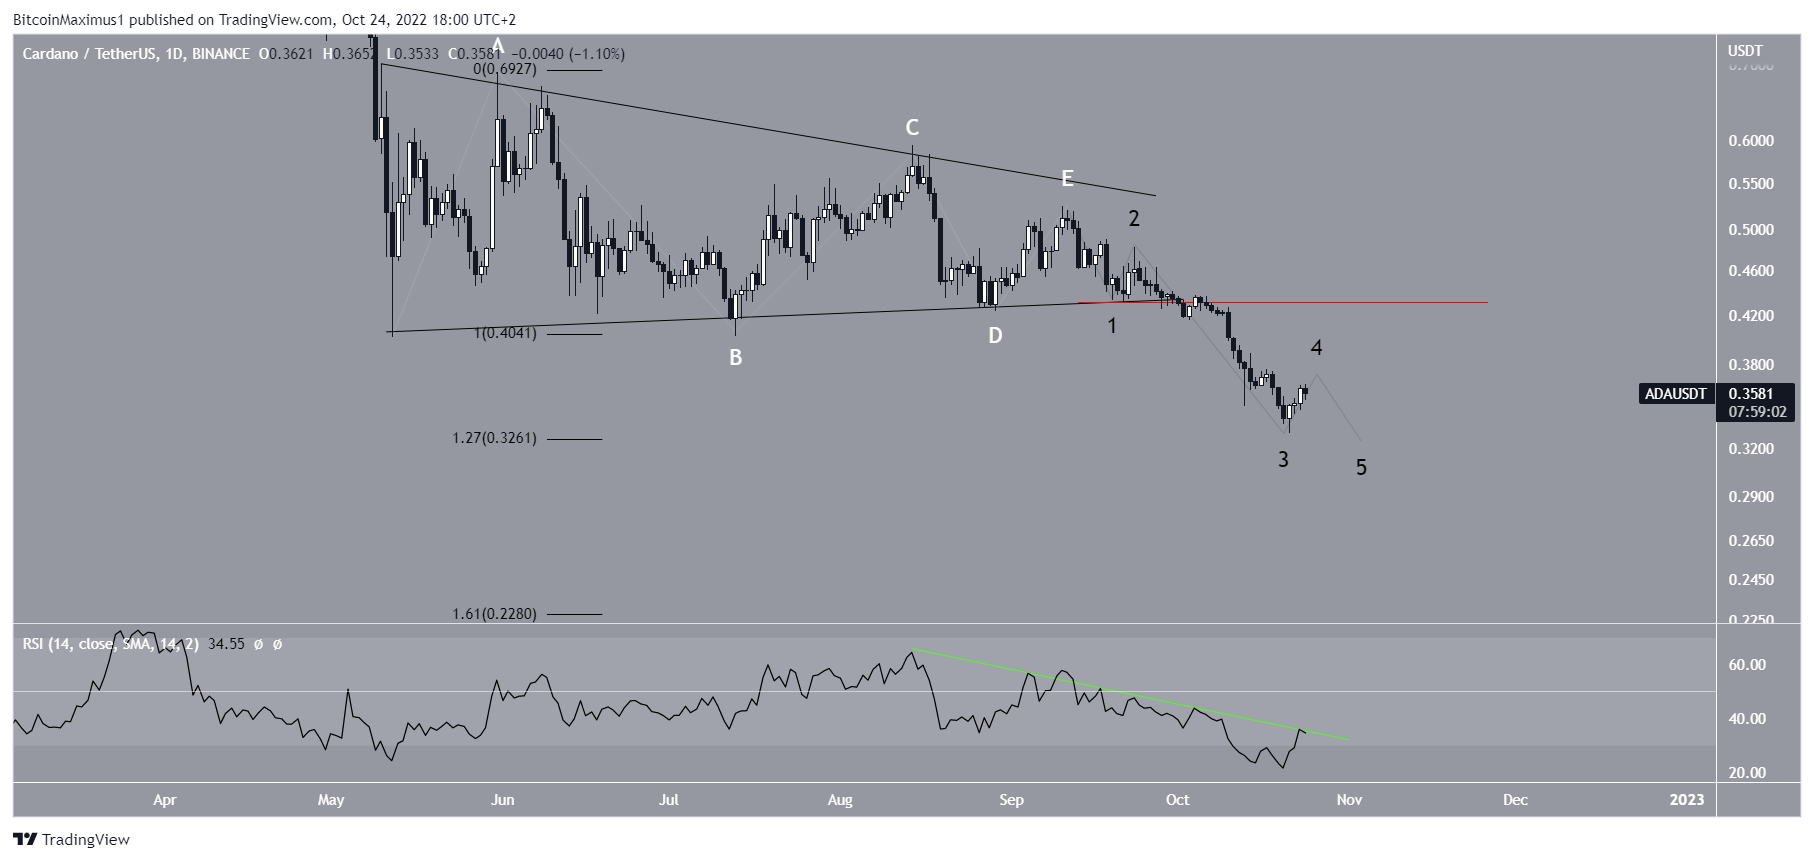
Conversely, an increase above the wave one low at $0.43 (red line) would invalidate the bearish ADA price prediction. Instead, it would indicate that a bullish reversal has begun.
It is worth noting that technical analysis indicators are bearish. In a similar fashion to the weekly RSI, the daily RSI is still bearish. It has not generated any sort of bullish divergence, nor has it broken out from its descending resistance line (green line).
For the latest BeInCrypto Bitcoin (BTC) and crypto market analysis, click here
Disclaimer: BeInCrypto strives to provide accurate and up-to-date information, but it will not be responsible for any missing facts or inaccurate information. You comply and understand that you should use any of this information at your own risk. Cryptocurrencies are highly volatile financial assets, so research and make your own financial decisions.
Disclaimer
All the information contained on our website is published in good faith and for general information purposes only. Any action the reader takes upon the information found on our website is strictly at their own risk.
Leave a Reply