

BeInCrypto looks at five altcoins that decreased the most from the entire crypto market last week, specifically from Dec. 30 to Jan. 6
These digital assets have taken the crypto news and crypto market spotlight:
- Huobi Token (HT) price decreased by 8.13%
- TRON (TRX) price decreased by 6.08%
- Internet Computer (ICP) price decreased by 4.82%
- Hedera Hashgraph (HBAR) price decreased by 3.37%
- XRP price decreased by 0.69%
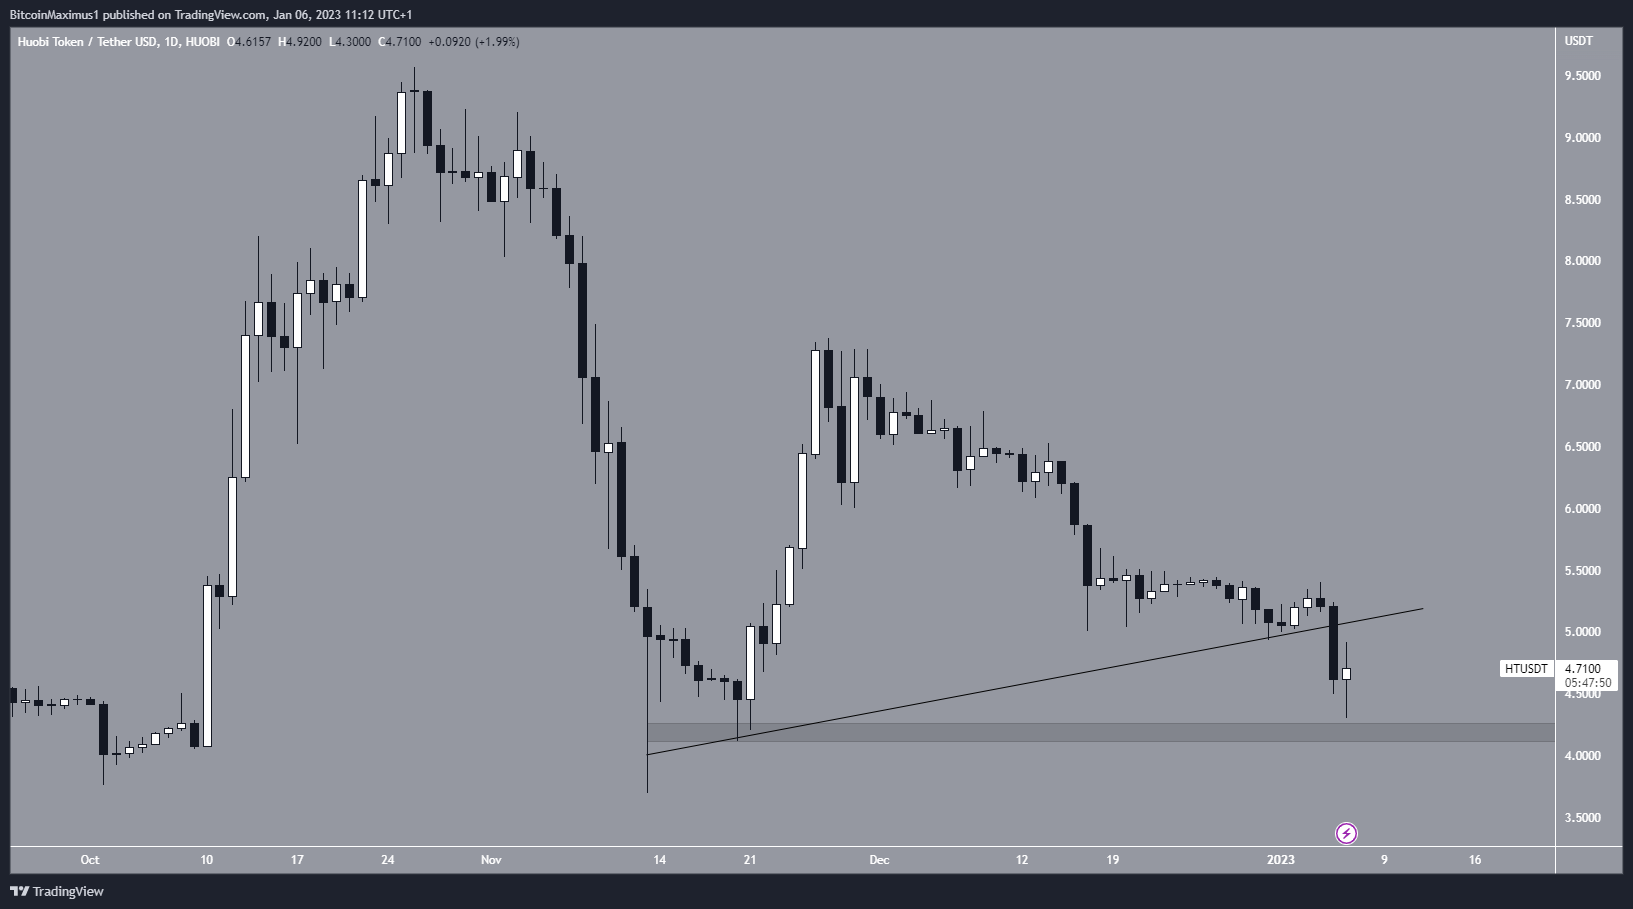
HT Leads Altcoins Rout
The HT price has been falling since reaching a high of $9.57 on Oct. 26. The downward movement led to a low of $3.70 on Nov. 13.
Afterward, the price initiated an upward movement alongside an ascending support line. However, that was also unsuccessful since the HT price broke down from the line on Jan. 5.
If the downward movement continues, the next closest support area would be at $4.25, created by the Nov. lows. On the other hand, reclaiming the support line would indicate that the trend is still bullish.
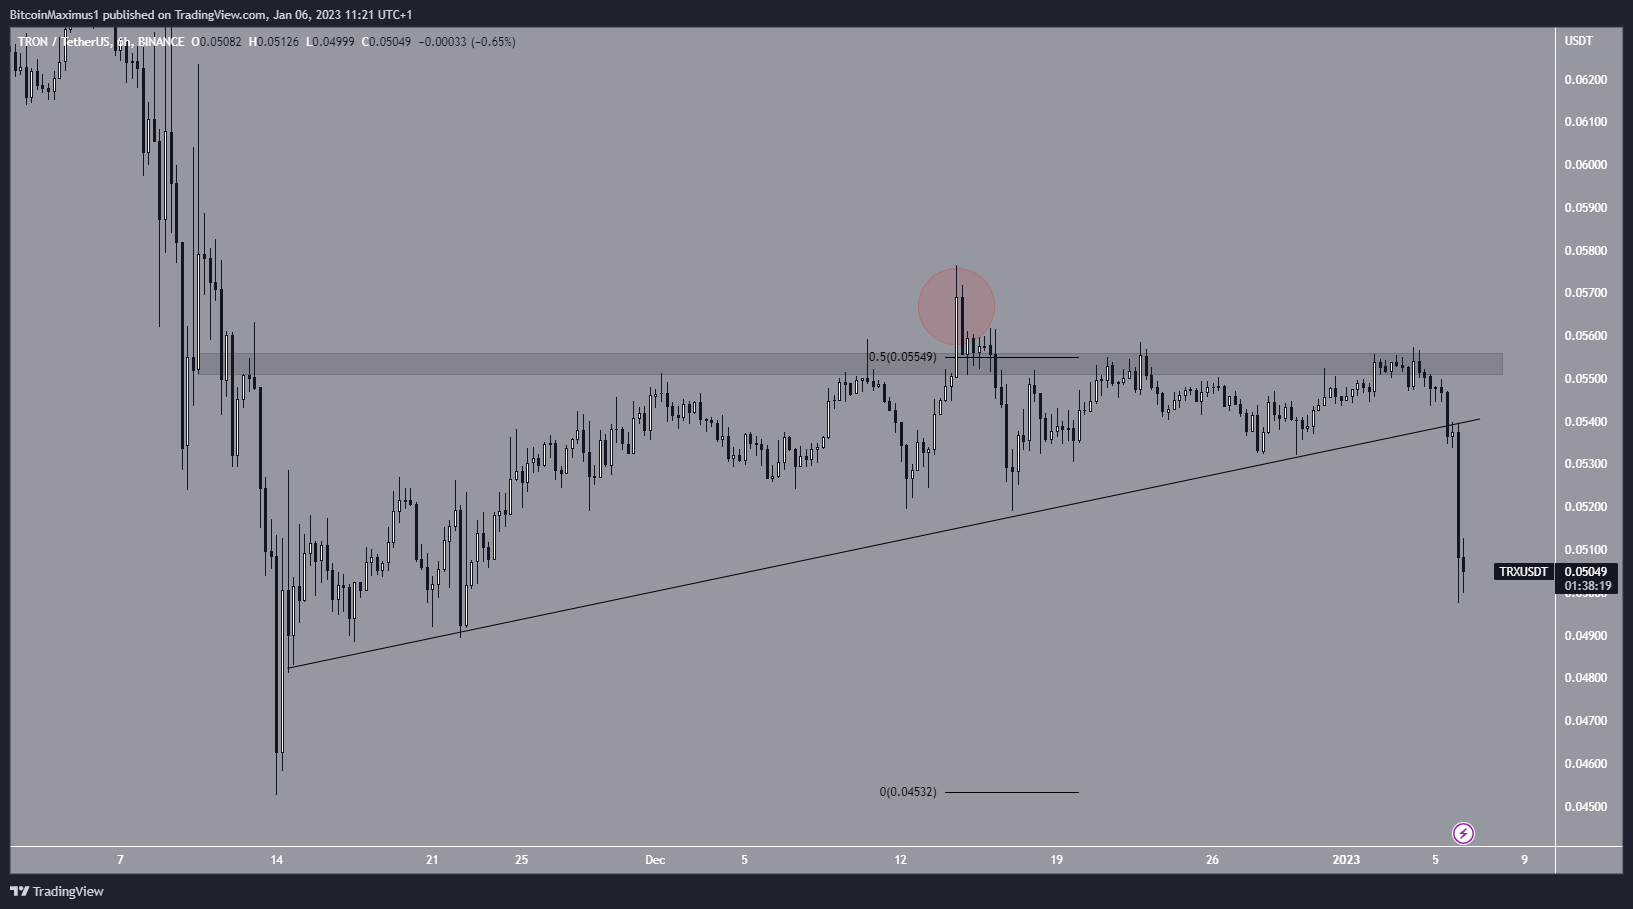
TRX Breaks Down From Support
Similar to HT, TRX broke down from an ascending support line amid a large bearish candlestick on Jan. 6. The breakdown occurred after the price has unsuccessfully attempted to move above the 0.5 Fib retracement resistance level at $0.056 (red circle).
If the downward movement continues, the next closest support area would be at the Nov. lows at $0.045. In order for the trend to be considered bullish, the TRX price has to reclaim the $0.056 resistance area.
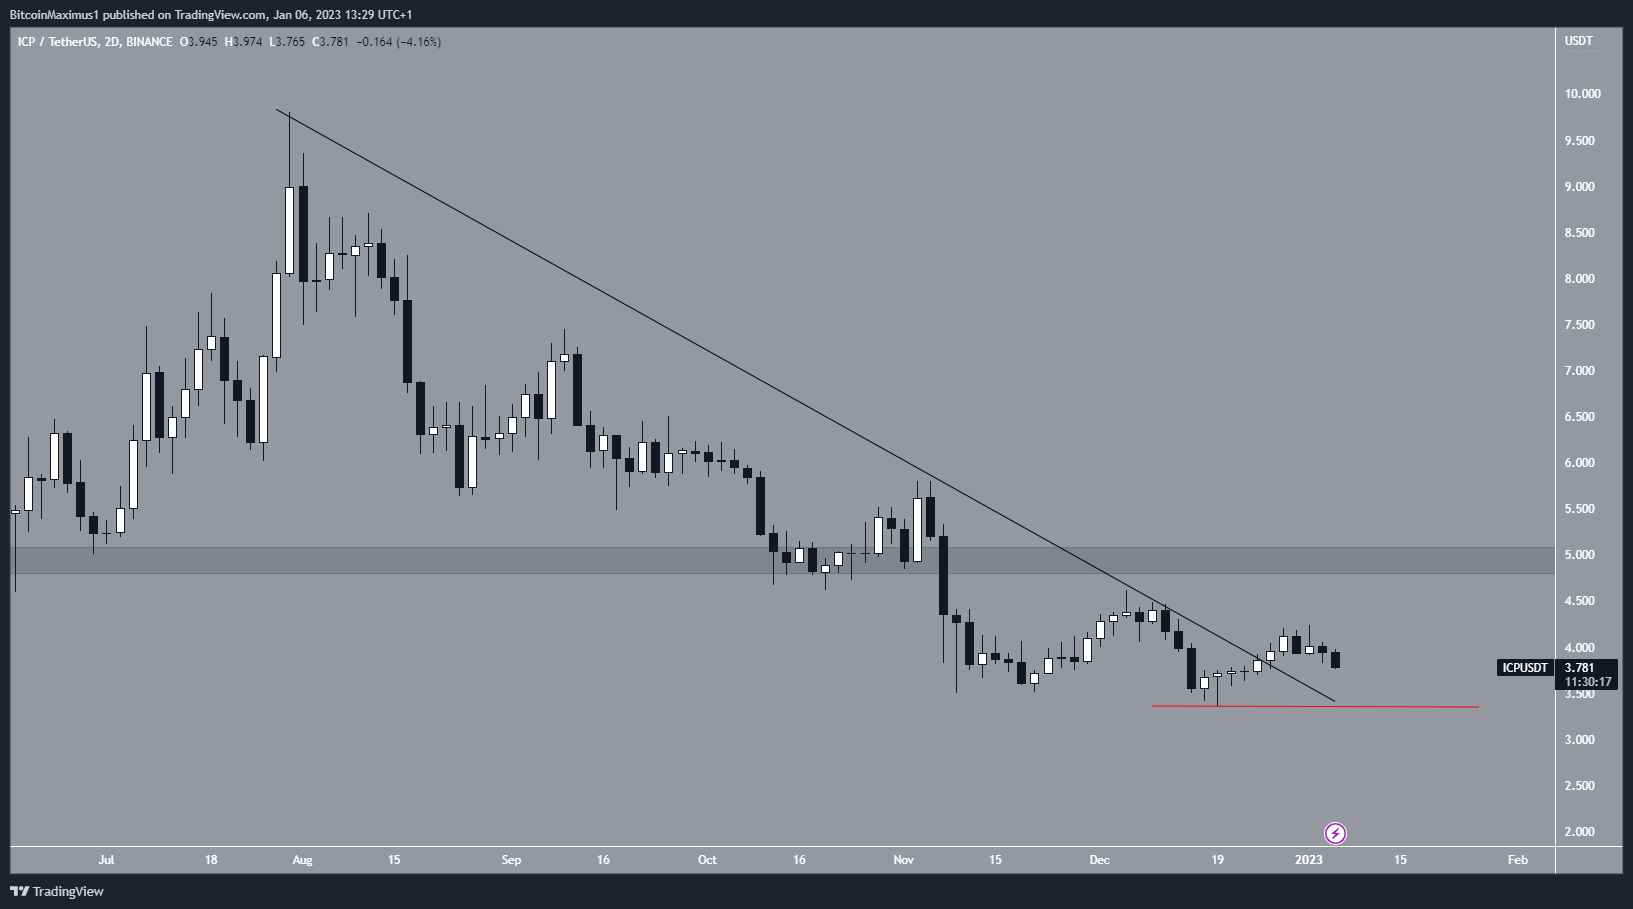
ICP Breaks Out From Resistance Line
Unlike the TRX and HT prices, the ICP price actually broke out from a descending resistance line, which had been in place since July. However, it has not initiated an upward movement yet and is trading close to its pre-breakout levels.
If an upward movement follows, the closest resistance area would be at $5. On the other hand, a drop below the Dec. lows of $3.35 (red line) would likely take the ICP toward a new all-time low.
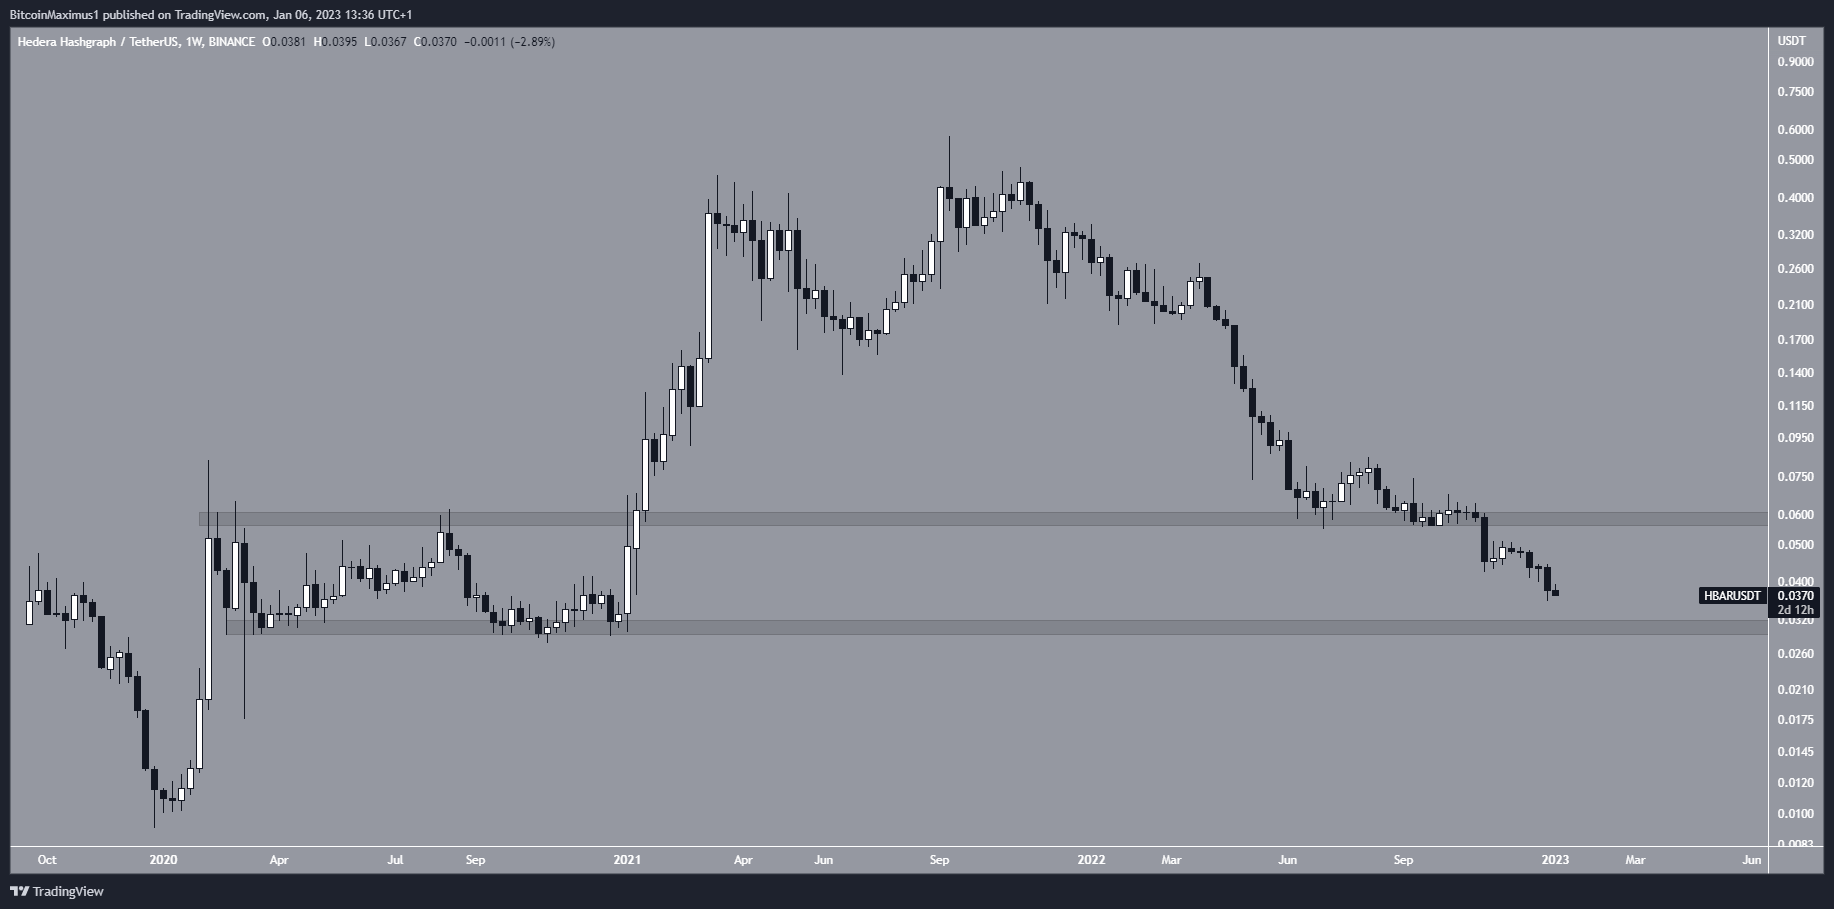
HBAR Altcoin Could Break Down Below 2021 Lows
The HBAR price has fallen since reaching an all-time high of $0.57 on Sept. 13. The downward movement led to a low of $0.035 in Dec. 13. An important development was that the price broke down from the $0.06 horizontal support area, which had been in place since the beginning of 2021.
Now, the HBAR price is expected to fall toward the next horizontal support area at $0.03. On the other hand, the trend cannot be considered bullish unless HBAR reclaims the $0.06 horizontal support area.
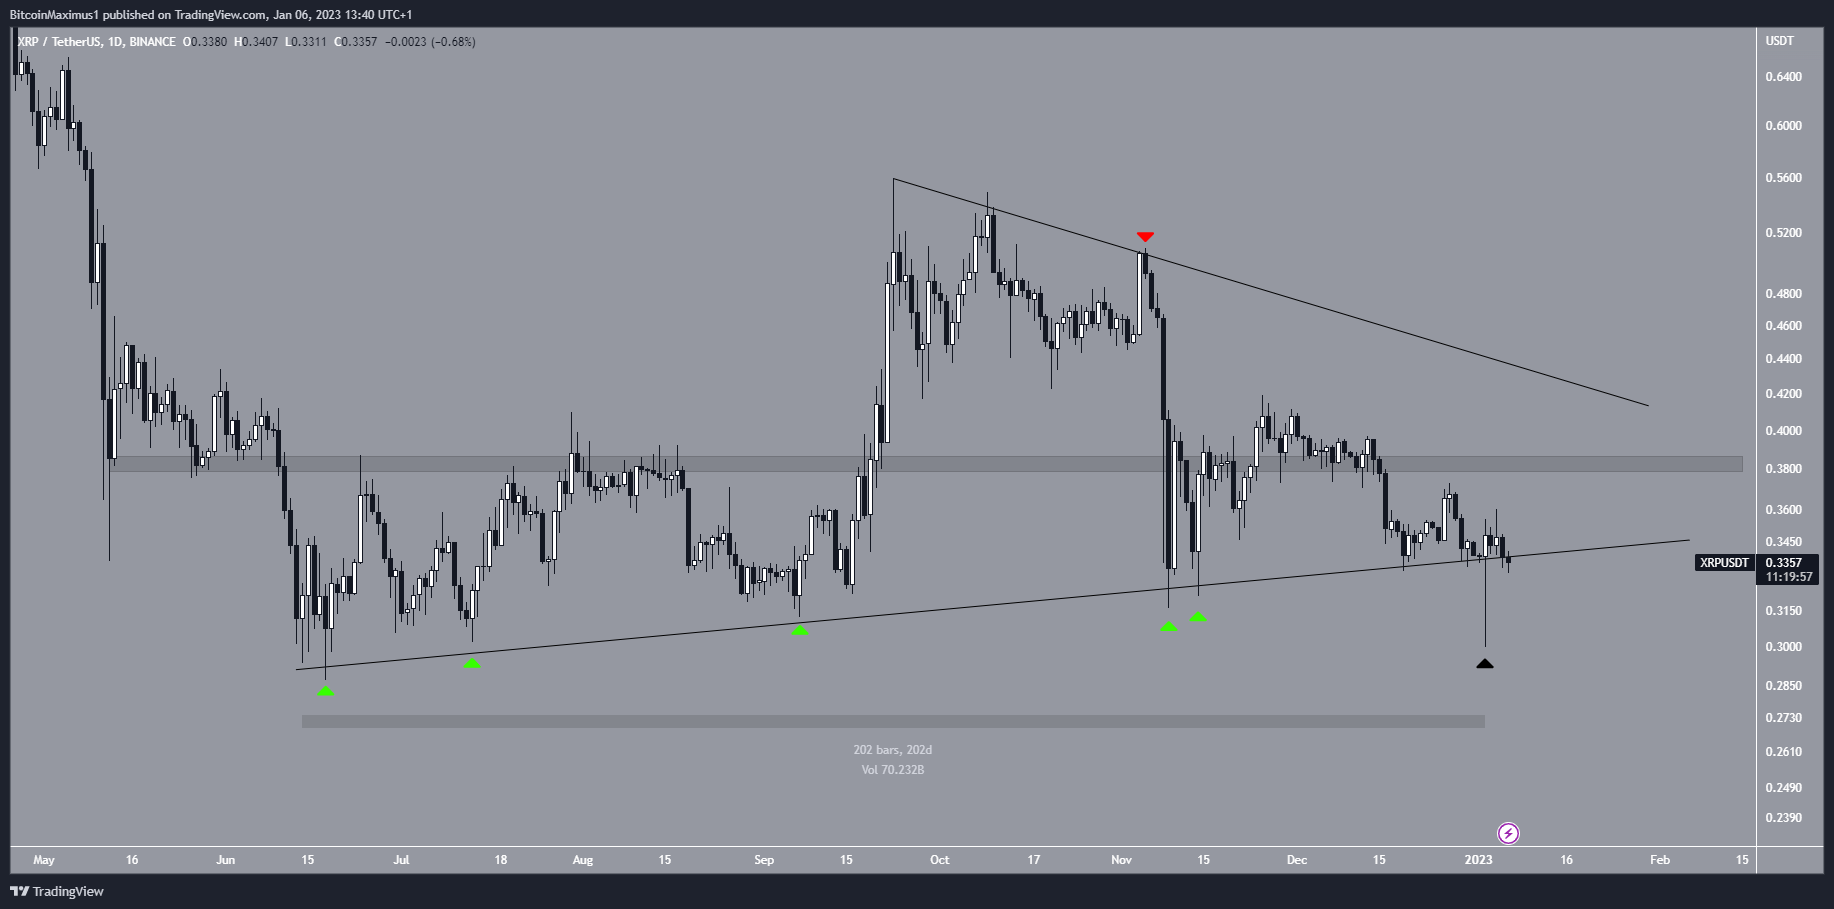
XRP Price Manages to Hold on Above Support
The XRP price has increased alongside an ascending support line over the past 202 days. The line has been validated numerous times so far.
While the XRP price seemingly broke down below it on Jan. 3, it created a long lower wick (black icon) and reclaimed the line shortly afterward.
Whether the XRP price breaks down from the ascending support line or reclaims the $0.38 resistance area instead will likely determine the direction of the future trend.
For BeInCrypto’s latest crypto market analysis, click here.
Disclaimer
BeInCrypto strives to provide accurate and up-to-date information, but it will not be responsible for any missing facts or inaccurate information. You comply and understand that you should use any of this information at your own risk. Cryptocurrencies are highly volatile financial assets, so research and make your own financial decisions.
Leave a Reply