

Even though Bitcoin (BTC) and the broader crypto market are experiencing an upswing in the first days of the new year, on-chain data shows that the market remains in a deep slumber. As Glassnode explains in its latest report, the BTC price has shown historically low volatility over the past weeks.
And according to the on-chain data for Bitcoin, there is currently little reason to believe that the boredom in the market will change quickly. However, if a move does occur, it will likely be an explosive market move, as in previous cycles when volatility was extremely low.
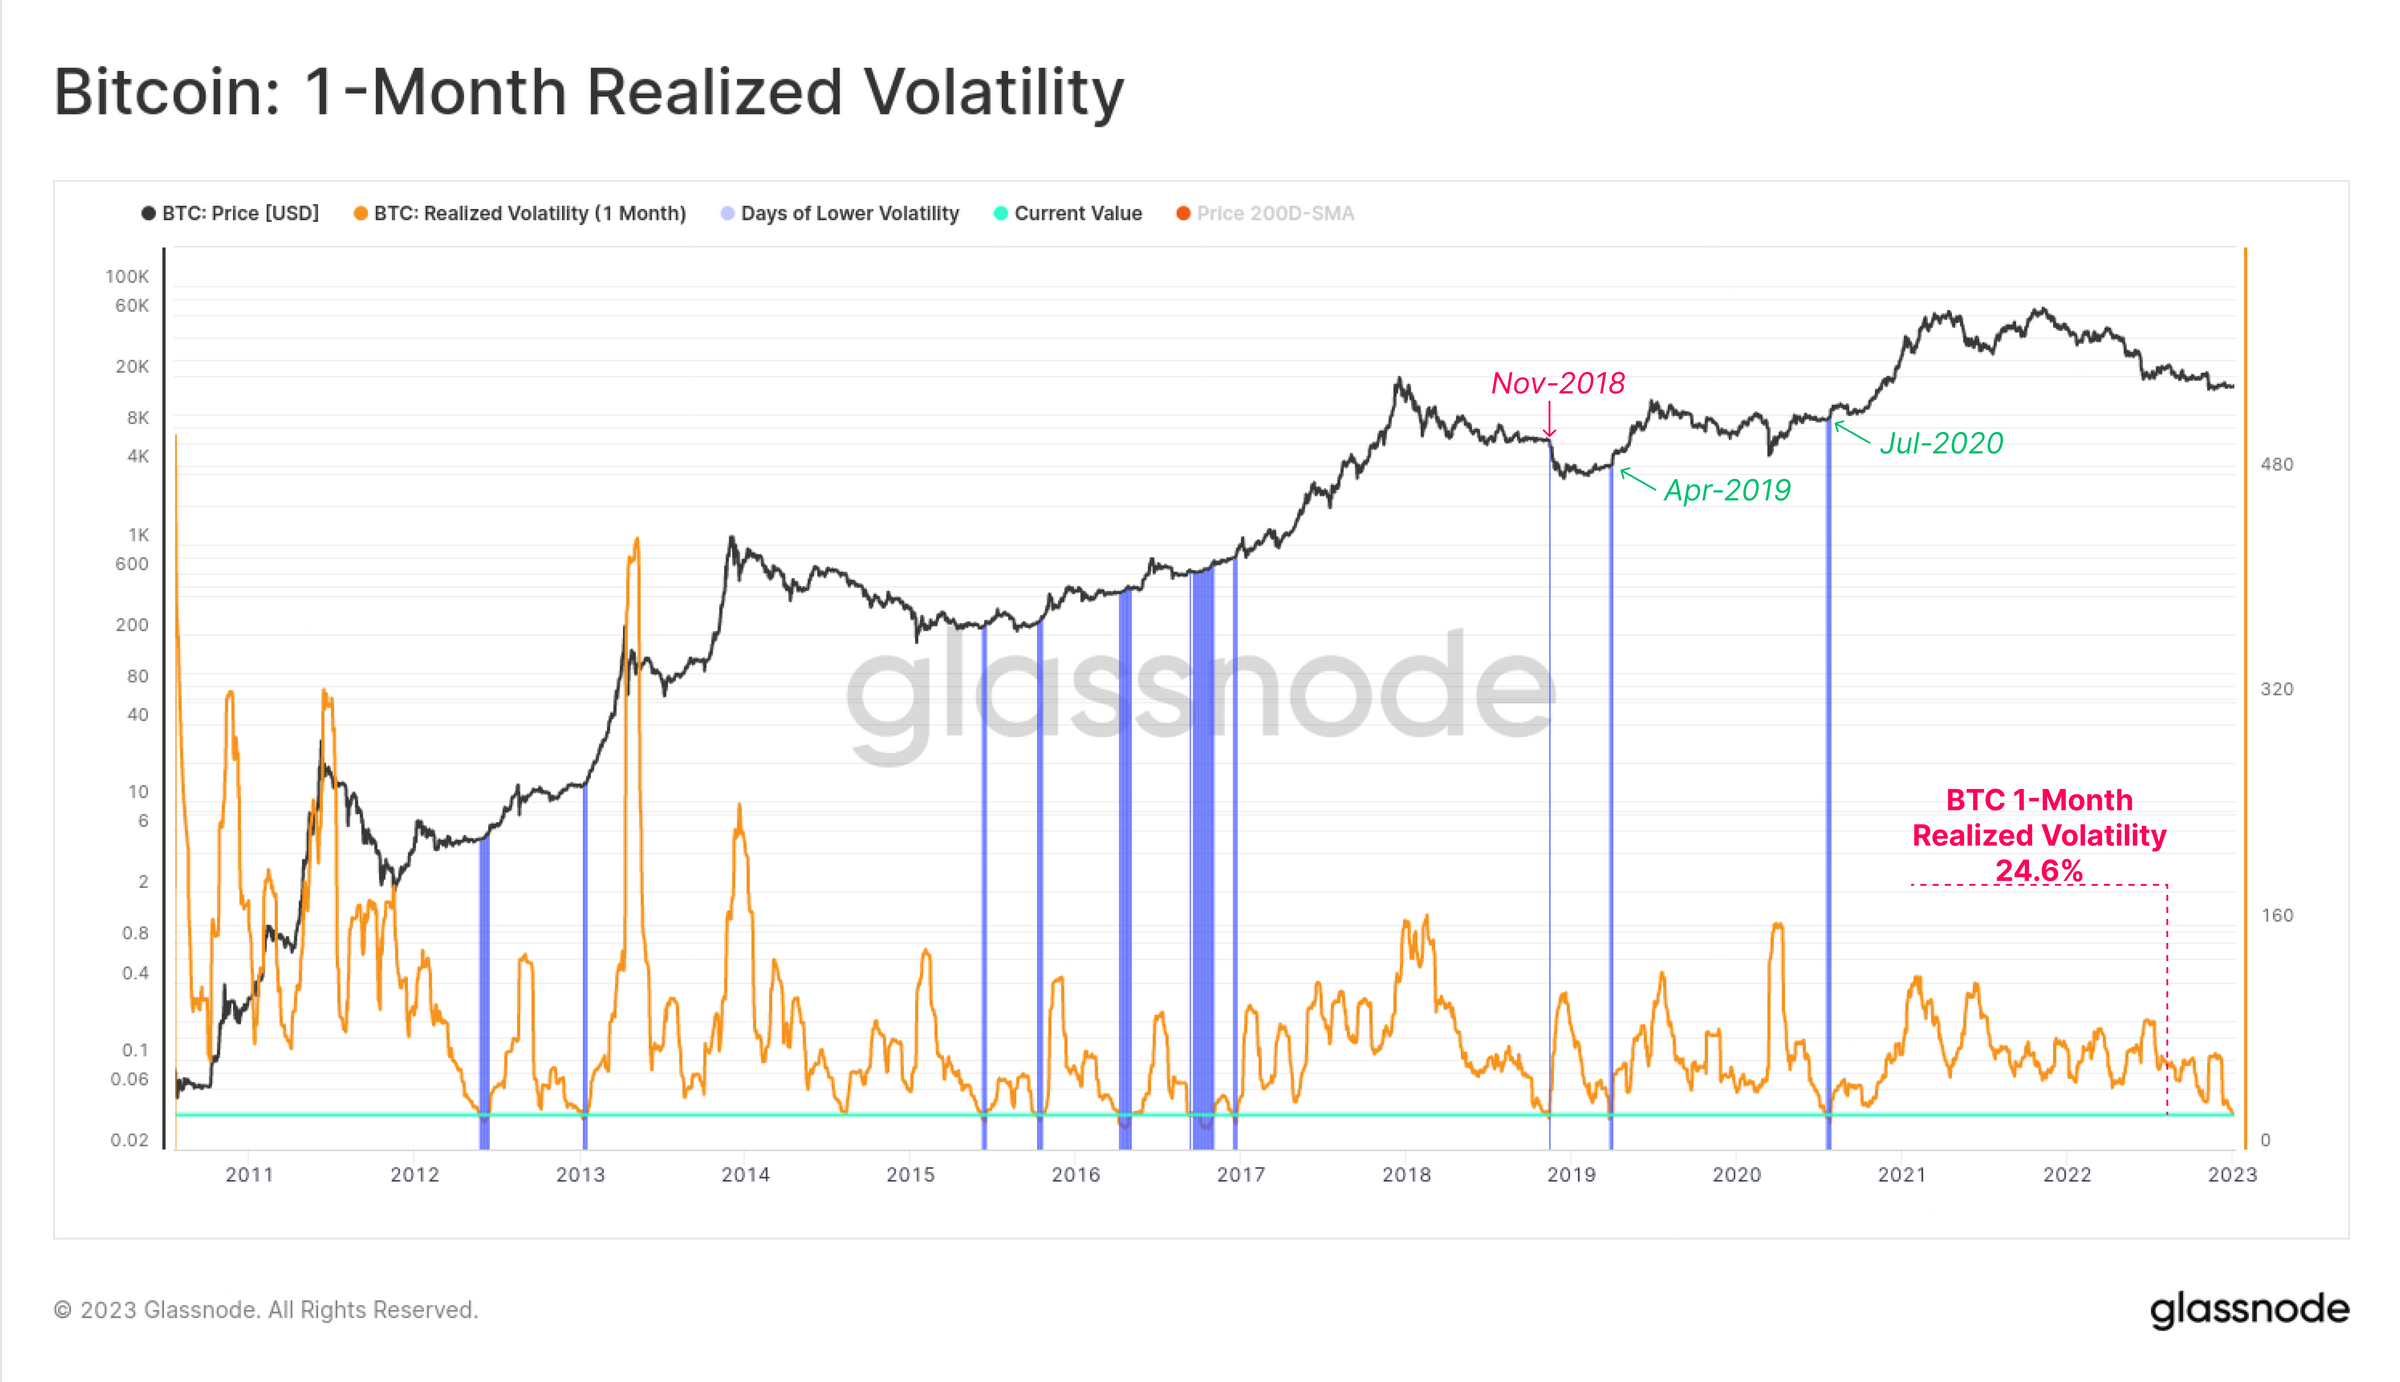
To support this thesis, Glassnode cites Bitcoin’s realized volatility over the last month, which is at a multi-year low of 24.6%. As the chart below shows, there have been a few times in Bitcoin’s history when it has been this low. In most cases, BTC saw a rally after the market awakened; only in one case, in November 2018, did the price fall dramatically (-50%) lower.
Bitcoin Network Usage Is Low
Also, the weak baseline for Bitcoin is identified by Glassnode in continued restrained network usage. While on-chain activity increased after the FTX collapse, the uptick briefly leveled off later. The monthly average of new Bitcoin addresses is approaching the annual average again.
The overall transaction value of the network is in free fall. While the daily transfer volume was still around $40 billion in the third quarter of 2022, it is currently only $5.8 billion/day. The value is thus back at the level before the bull year 2020.
According to Glassnode, this indicates a displacement of institutional capital. This is reflected in the fact that the share of transfers of more than $10 million has fallen from 42.8% before the collapse of FTX to only 19.0%. Glassnode states:
This suggests a significant lull in institutional sized capital flows, and perhaps a serious shaking of confidence occurring among this cohort. It may also reflect, in part, and sadly, an expulsion of the questionable capital flows associated with the FTX/Alameda entities.
One indicator of a breakout from boredom could be the inflows and outflows on exchanges. But again, Glassnode notes that the on-chain data does not yet signal any momentum for an explosive move. Bitcoin inflows are currently between $350 million and $400 million per day, a far cry from the billions seen in 2021-22, according to Glassnode.
Major Indicator Remains Bearish
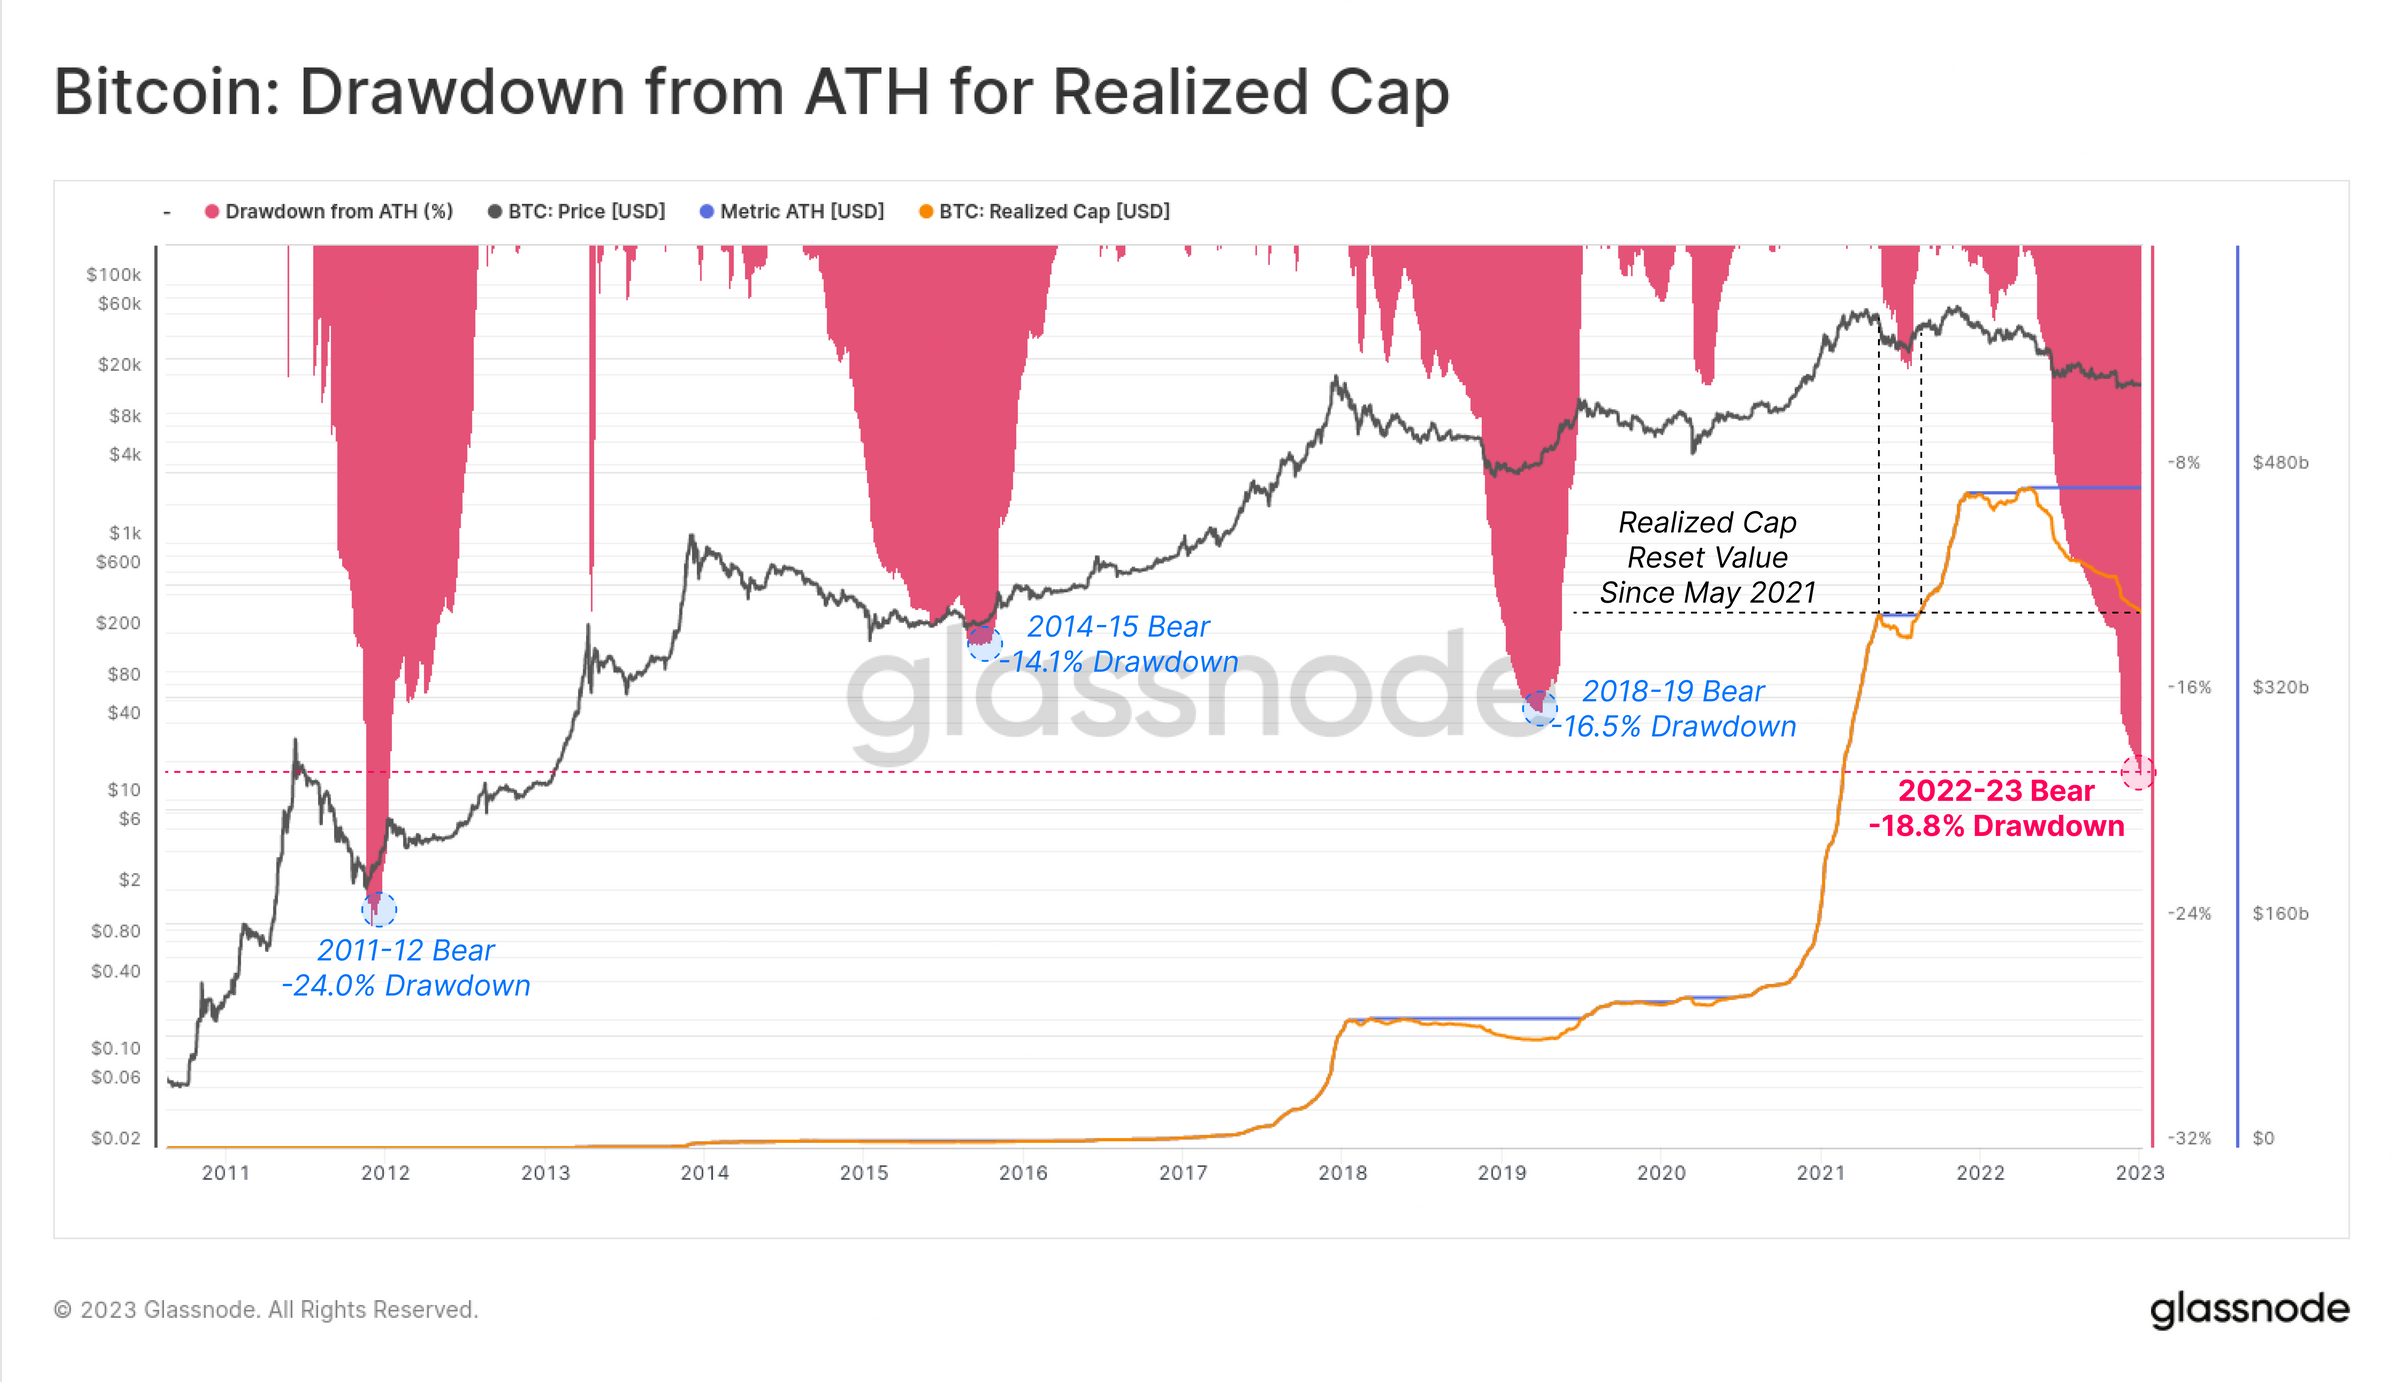
According to the research firm, the Realized Cap is one of the most important metrics in on-chain analysis. Unfortunately, the metric currently gives BTC investors just as little hope for a change anytime soon. The Bitcoin Realized Cap has declined 18.8% since the all-time high, representing a net capital outflow of -$88.4 billion from the network.
“This makes for the second largest relative decline in history, and the largest in terms of USD realized losses,” Glassnode notes, pointing at the following chart. Only in 2011/2012, the bear market drawdown was worse by 24%.
Concluding the report, Glassnode says:
[I]t is rare for such conditions to stick around for long. Past occasions where BTC and ETH volatility was this low have preceded extremely volatile market environments, with past examples trading both higher and lower.
At press time, the BTC was slowly grinding higher in the 1-day chart. The price stood at $17,268.
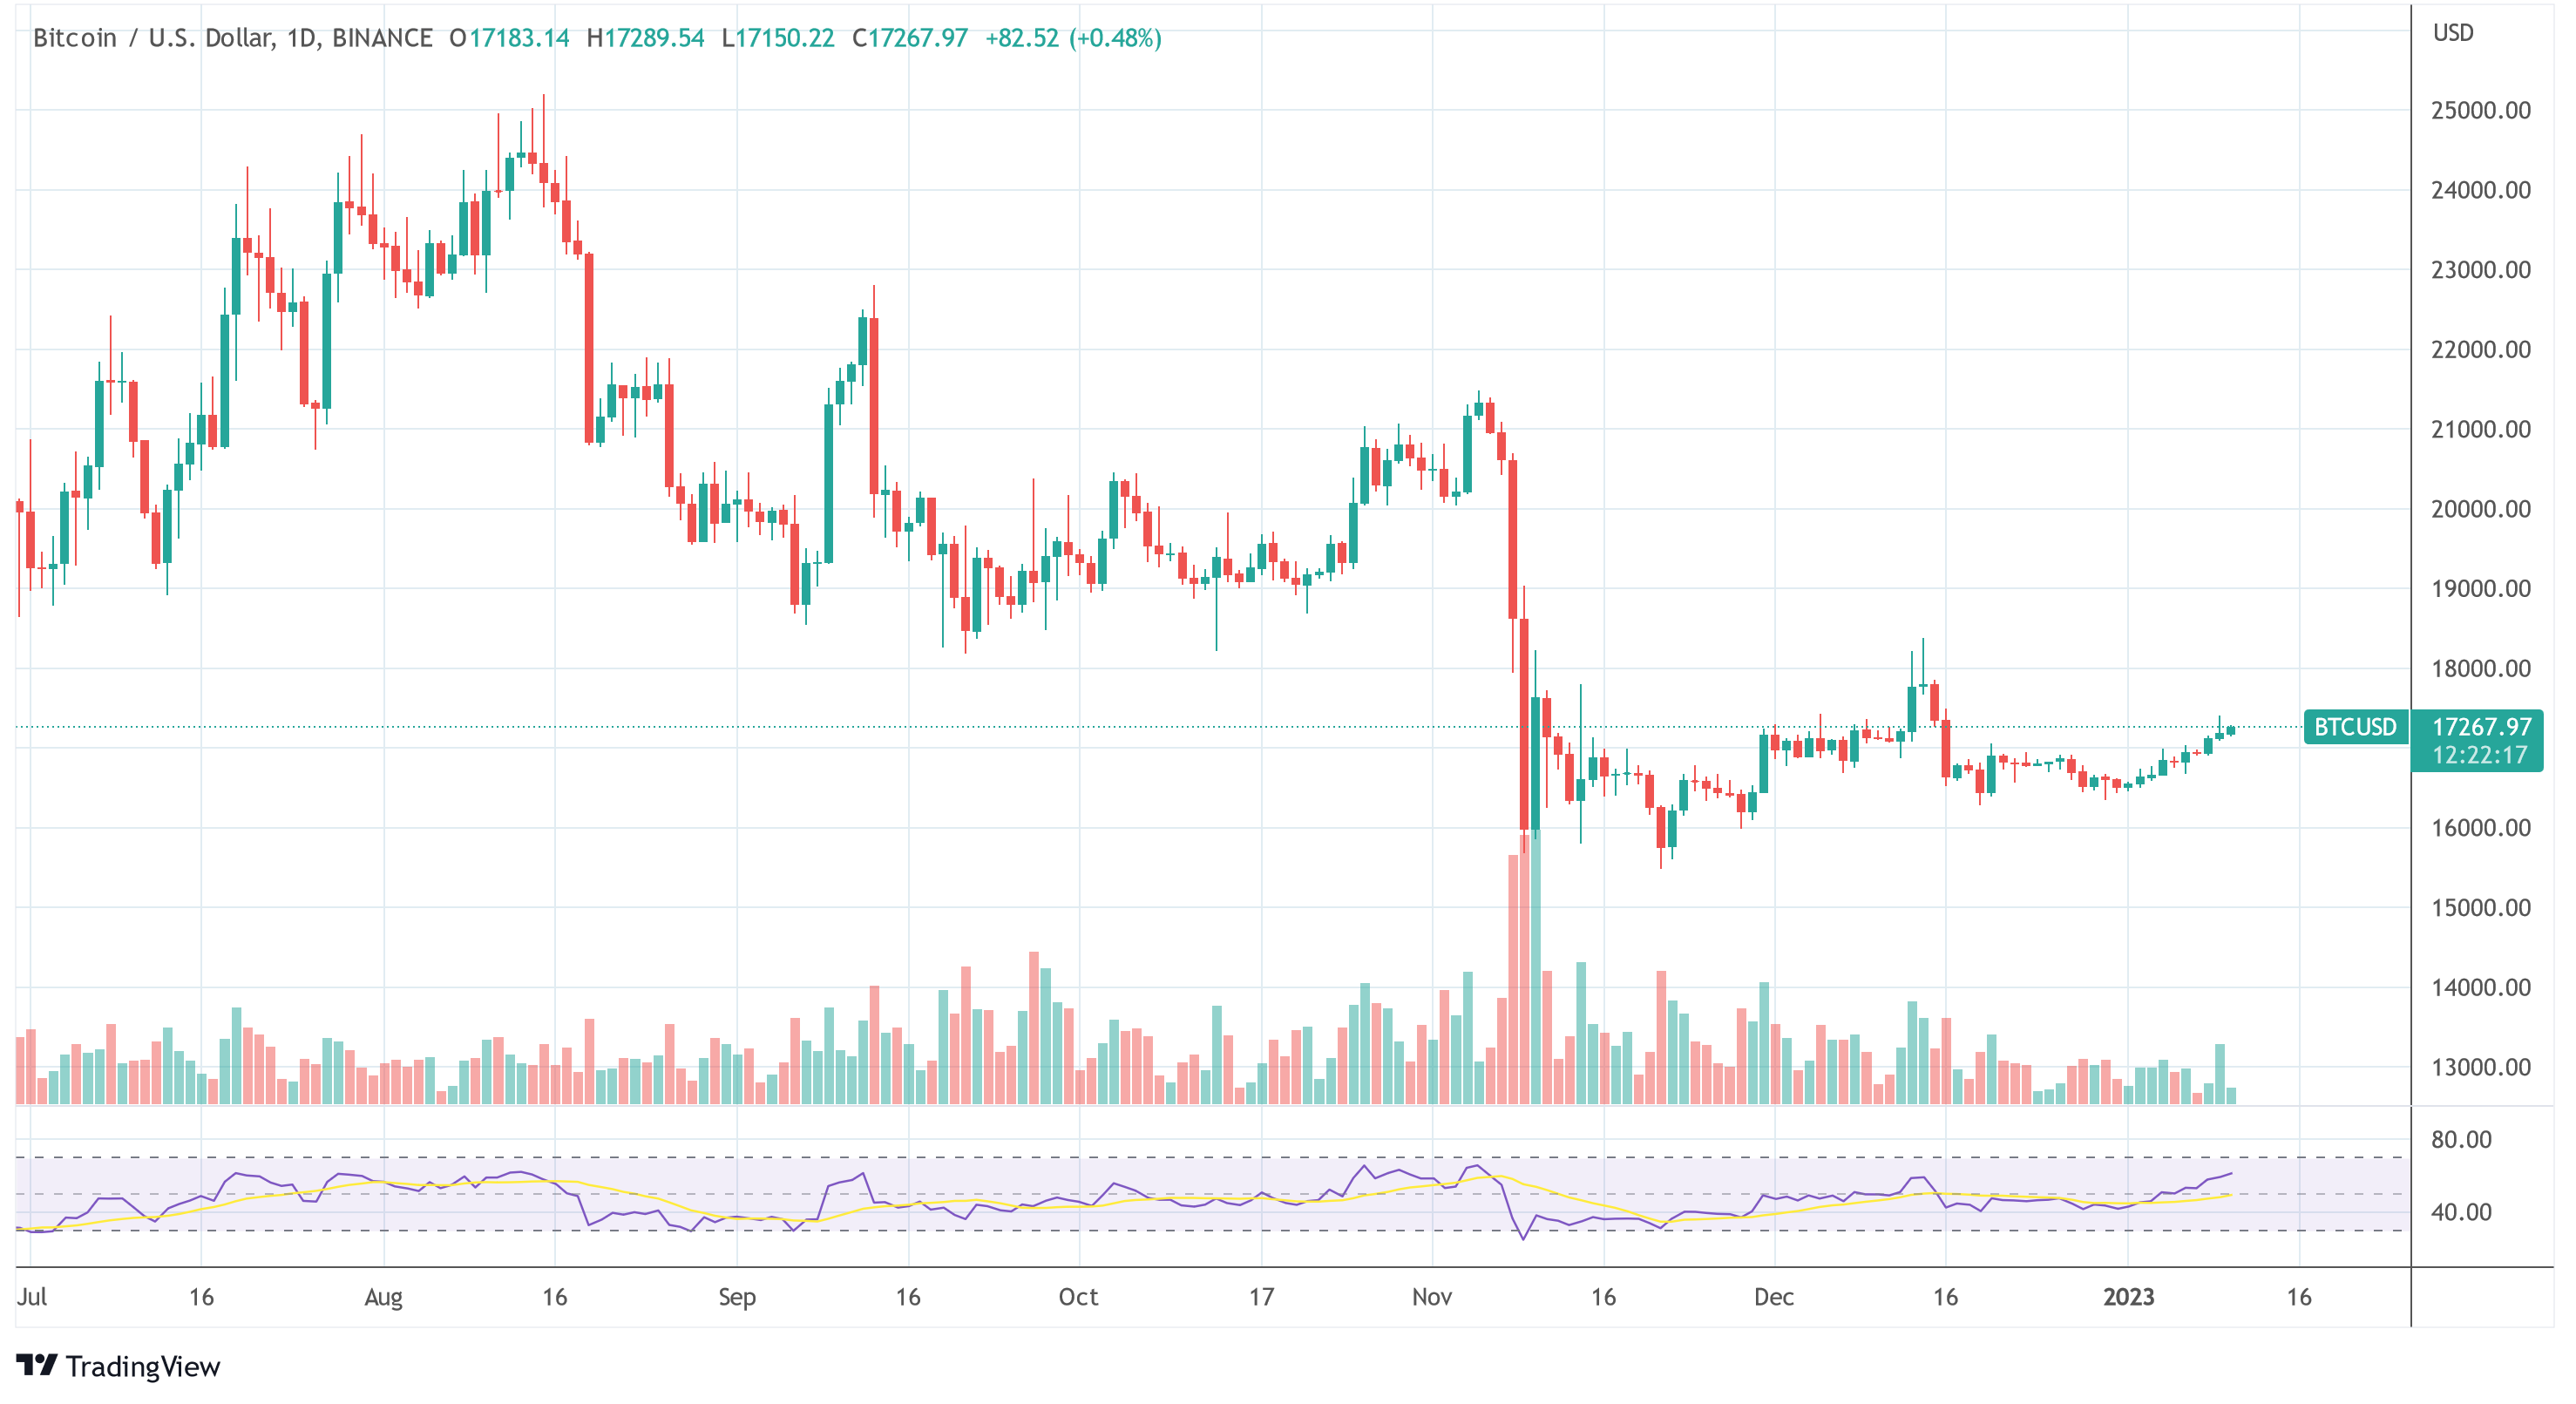
Featured image from Jievani Weerasinghe / Unsplash, Chart from TradingView.com
Leave a Reply