

The Binance Coin (BNB) price completed a corrective structure and is moving toward its Nov. 2021 highs at $398.
Federal prosecutors are probing the Binance exchange as part of an investigation into hedge funds. Additionally, FTX founder Sam Bankman-Fried blamed Binance for the implosion of FTX, stating that the CEO of Binance precipitated the crash.
In some positive Binance news, the exchange officially launched Binance Mirror, a crypto settlement solution allowing institutional investors to store their backing assets using leverage in the exchange. This is a big step in Binance’s appeasement of institutional investors.
Furthermore, BNB burning is still occurring, with the 22nd burn completed on Jan. 17. A total of 2,064,494 BNB coins were burned, with a value of $575 million.
Long-Term Range Reclaim
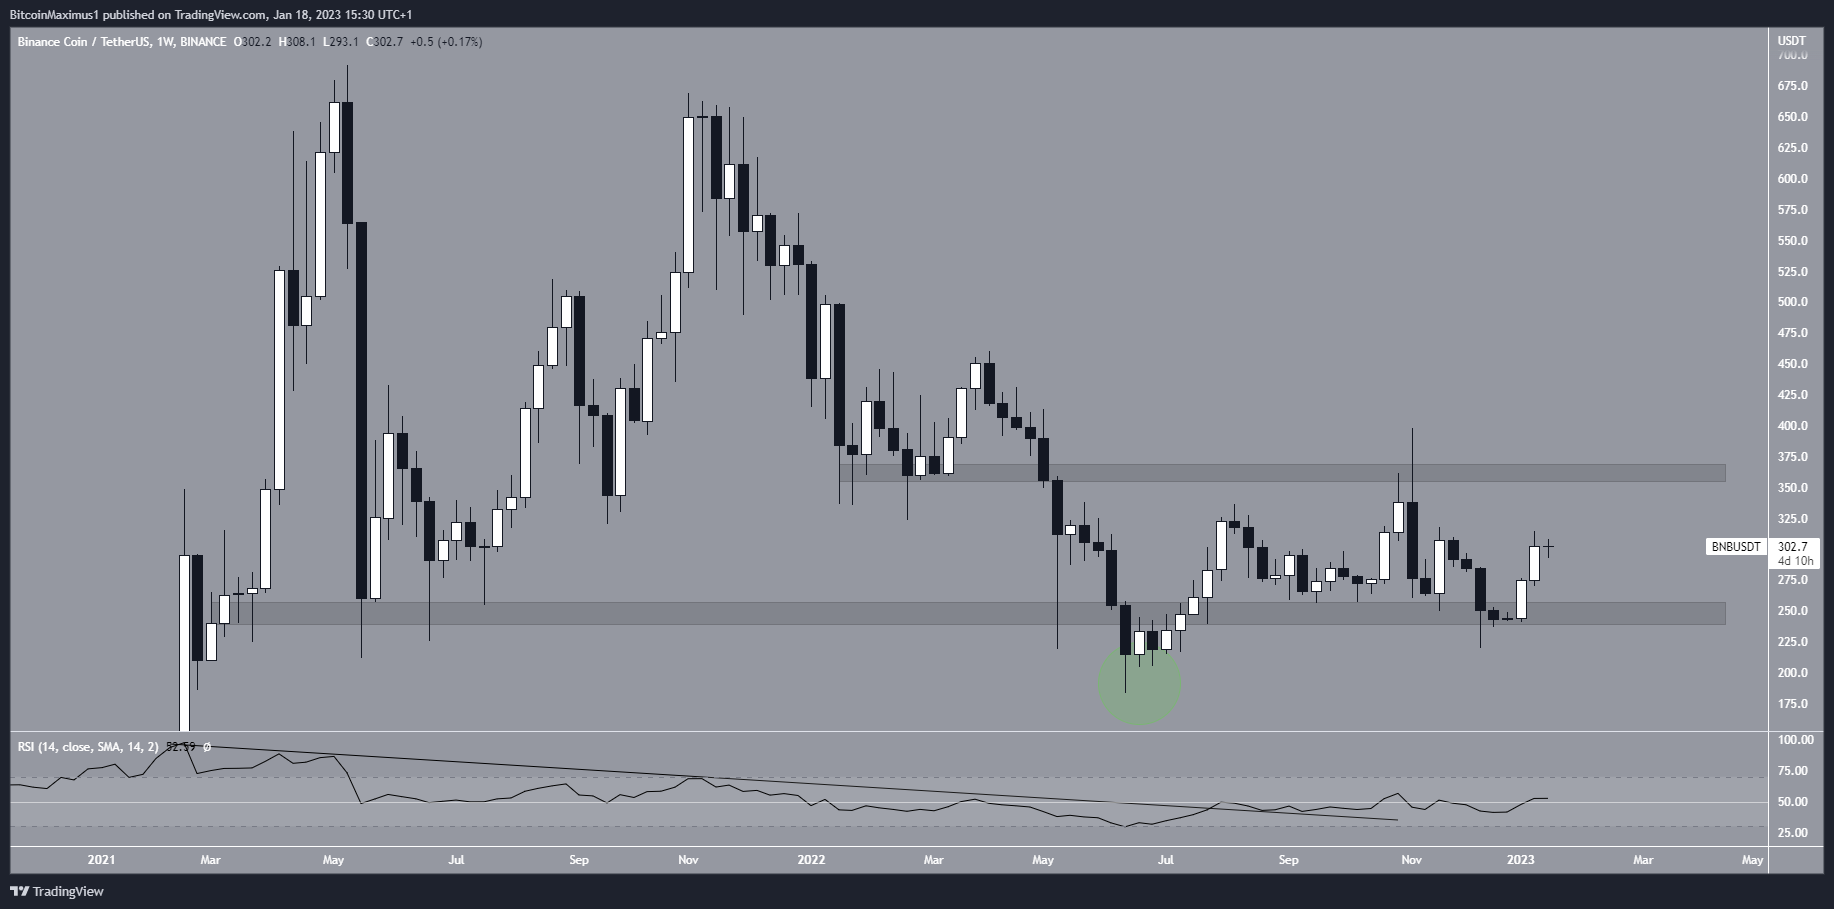
The technical analysis from the weekly time frame shows that the Binance Coin price reclaim the $250 horizontal support area after deviating below it in May 2021 (green circle).
Afterward, it reached a high of $398 before decreasing, in turn creating a long upper wick and validating the $360 area as resistance.
Since then, the Binance Coin price has consolidated within this range. The ongoing upward movement created a higher low relative to the May 2021 lows, which is considered a bullish sign. This is the first sign that suggests the ongoing downward movement since the all-time high might end.
Furthermore, the weekly RSI is bullish, since it has broken out from a descending resistance line and moved above 50. This supports the possibility that the BNB price will increase toward the range high at $360.
A weekly close below $250 would invalidate this bearish outlook.
Binance Coin Price Wave Count Suggests Rally Will Continue
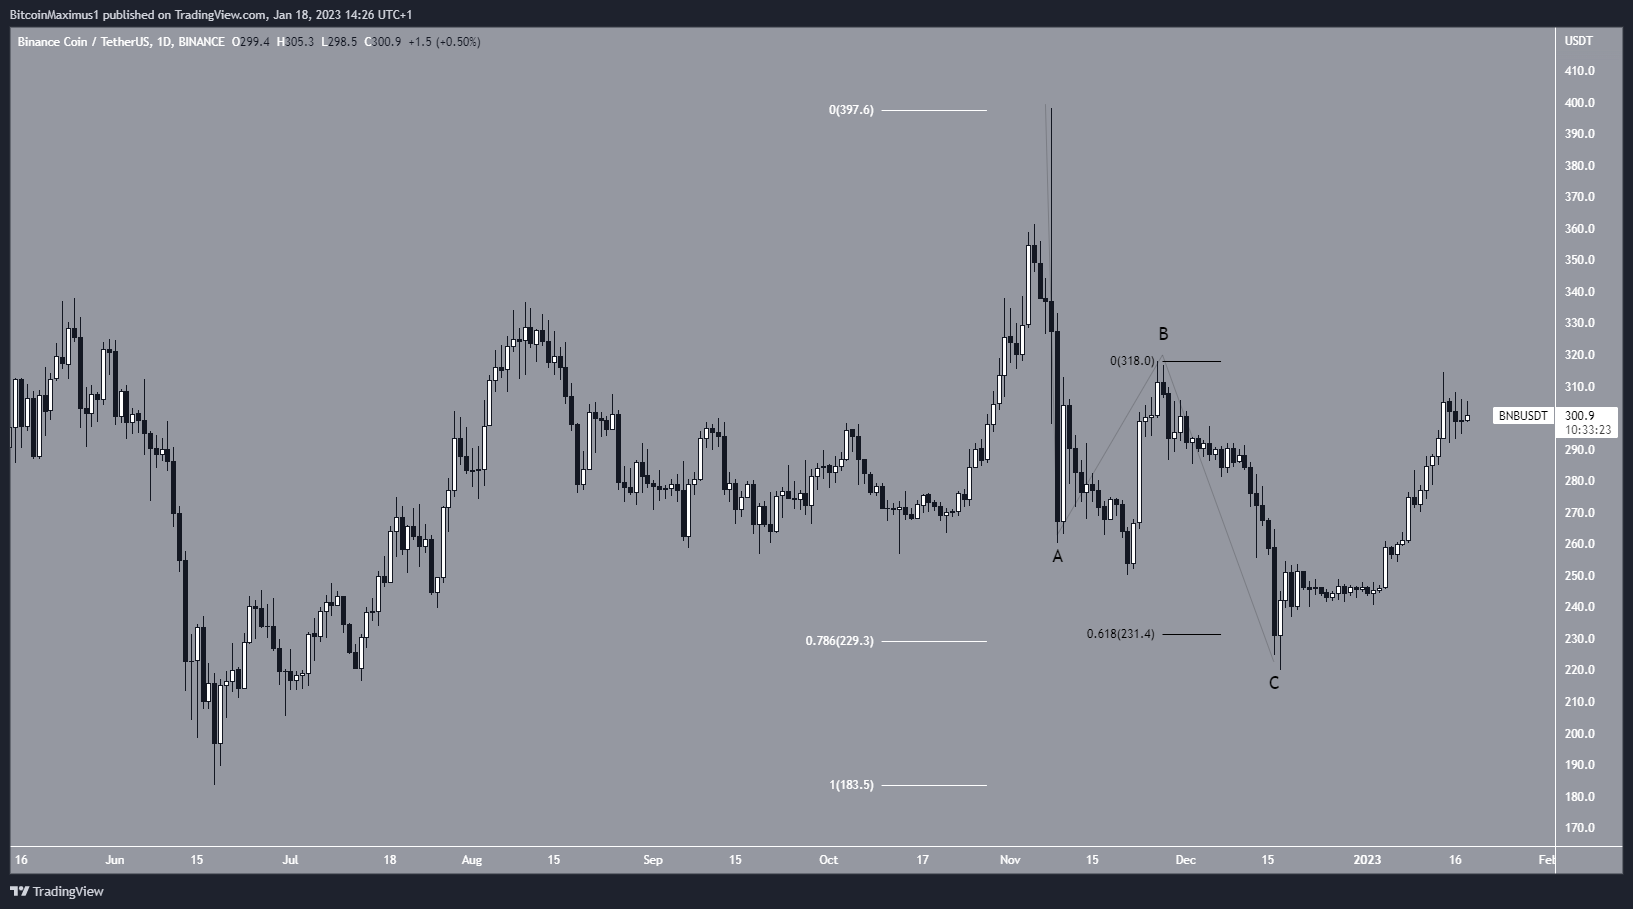
The decrease from Nov. 8 to Dec. 16 is almost certainly an A-B-C corrective structure. It is definitively a three-wave structure, waves A:C have a 1:0.618 ratio, and it ended at the 0.786 Fib retracement support level (white). As a result, all signs point to it being a completed A-B-C structure (black).
If that is correct, there are two possibilities for the future Binance Coin price movement. Both of them indicate that the upward trend is likely to continue in the short-term, despite the slight drop over the past 24 hours.
The bullish scenario suggests that the BNB price has begun a new five-wave upward movement (red). It is currently in wave three and will eventually move above $400. A decrease below the wave one high at $255 (red line) would invalidate this potential outline.
The bearish scenario suggests that the BNB price is still in a large A-B-C corrective structure (white). However, because the first drop is a three-wave structure as outlined prior, the BNB price would still be expected to reach at least $372 before falling.
Therefore, the reaction once the Binance Coin price gets there will likely determine the direction of the future trend.
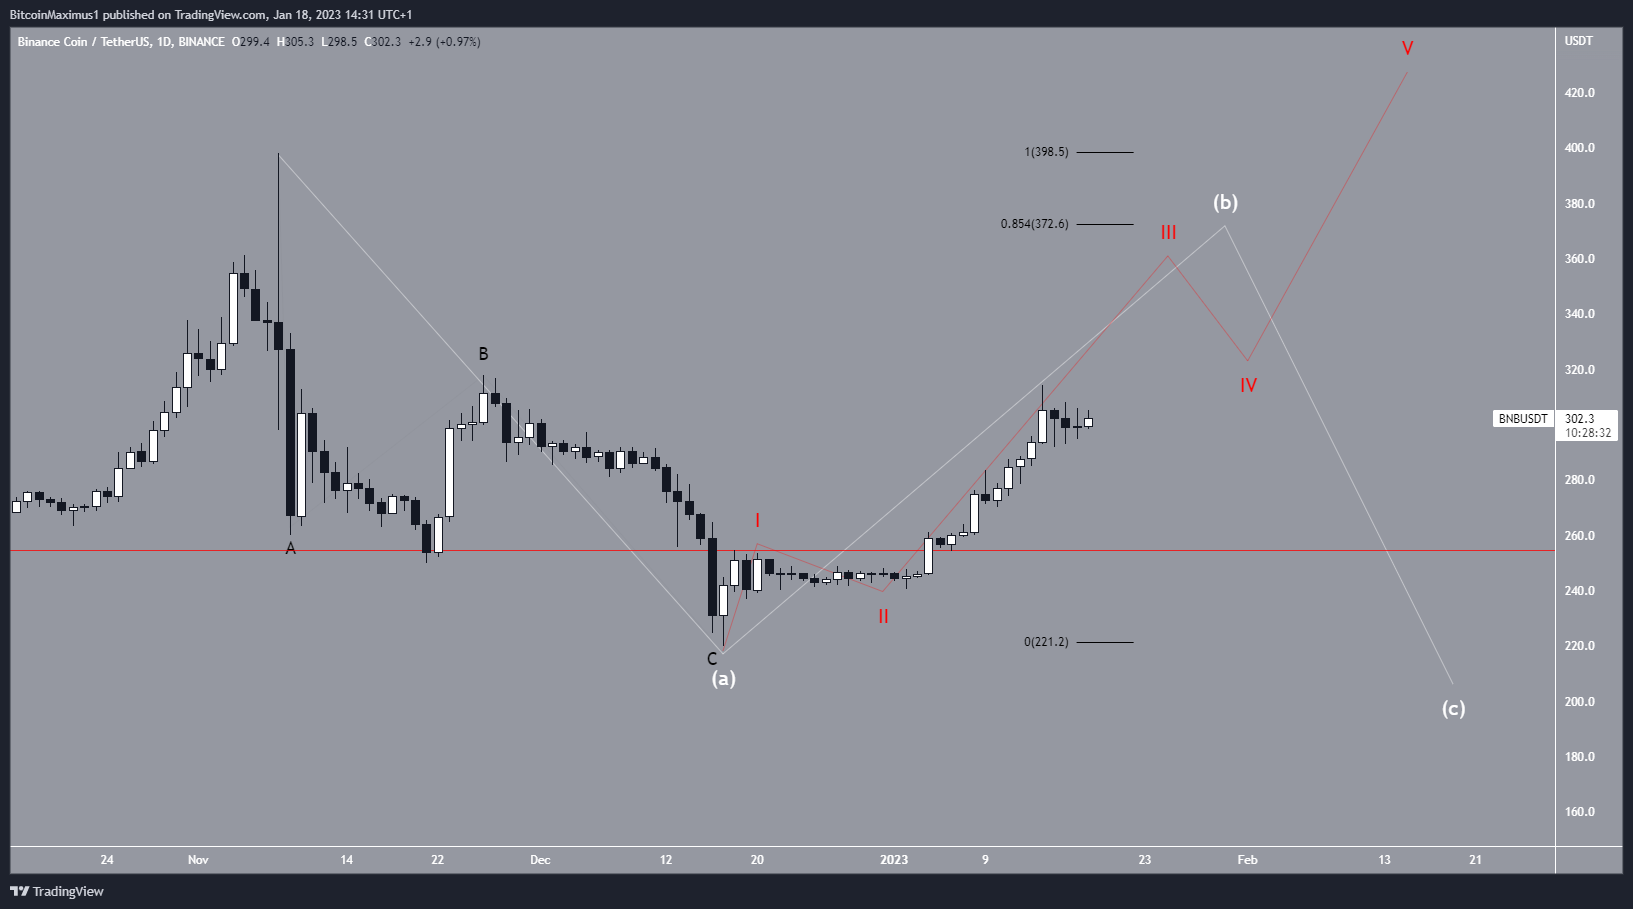
To conclude, while the Binance Coin price trend is still unclear, an increase toward $370 is the most likely short-term outcome. A fall below $255 would invalidate this short-term bullish outlook.
For BeInCrypto’s latest crypto market analysis, click here.
Disclaimer
BeInCrypto strives to provide accurate and up-to-date information, but it will not be responsible for any missing facts or inaccurate information. You comply and understand that you should use any of this information at your own risk. Cryptocurrencies are highly volatile financial assets, so research and make your own financial decisions.
Leave a Reply