

BeInCrypto looks at five biggest altcoins losers in the entire crypto market this week, specifically from Feb. 17-24.
The altcoins that have fallen the most in the entire crypto market are:
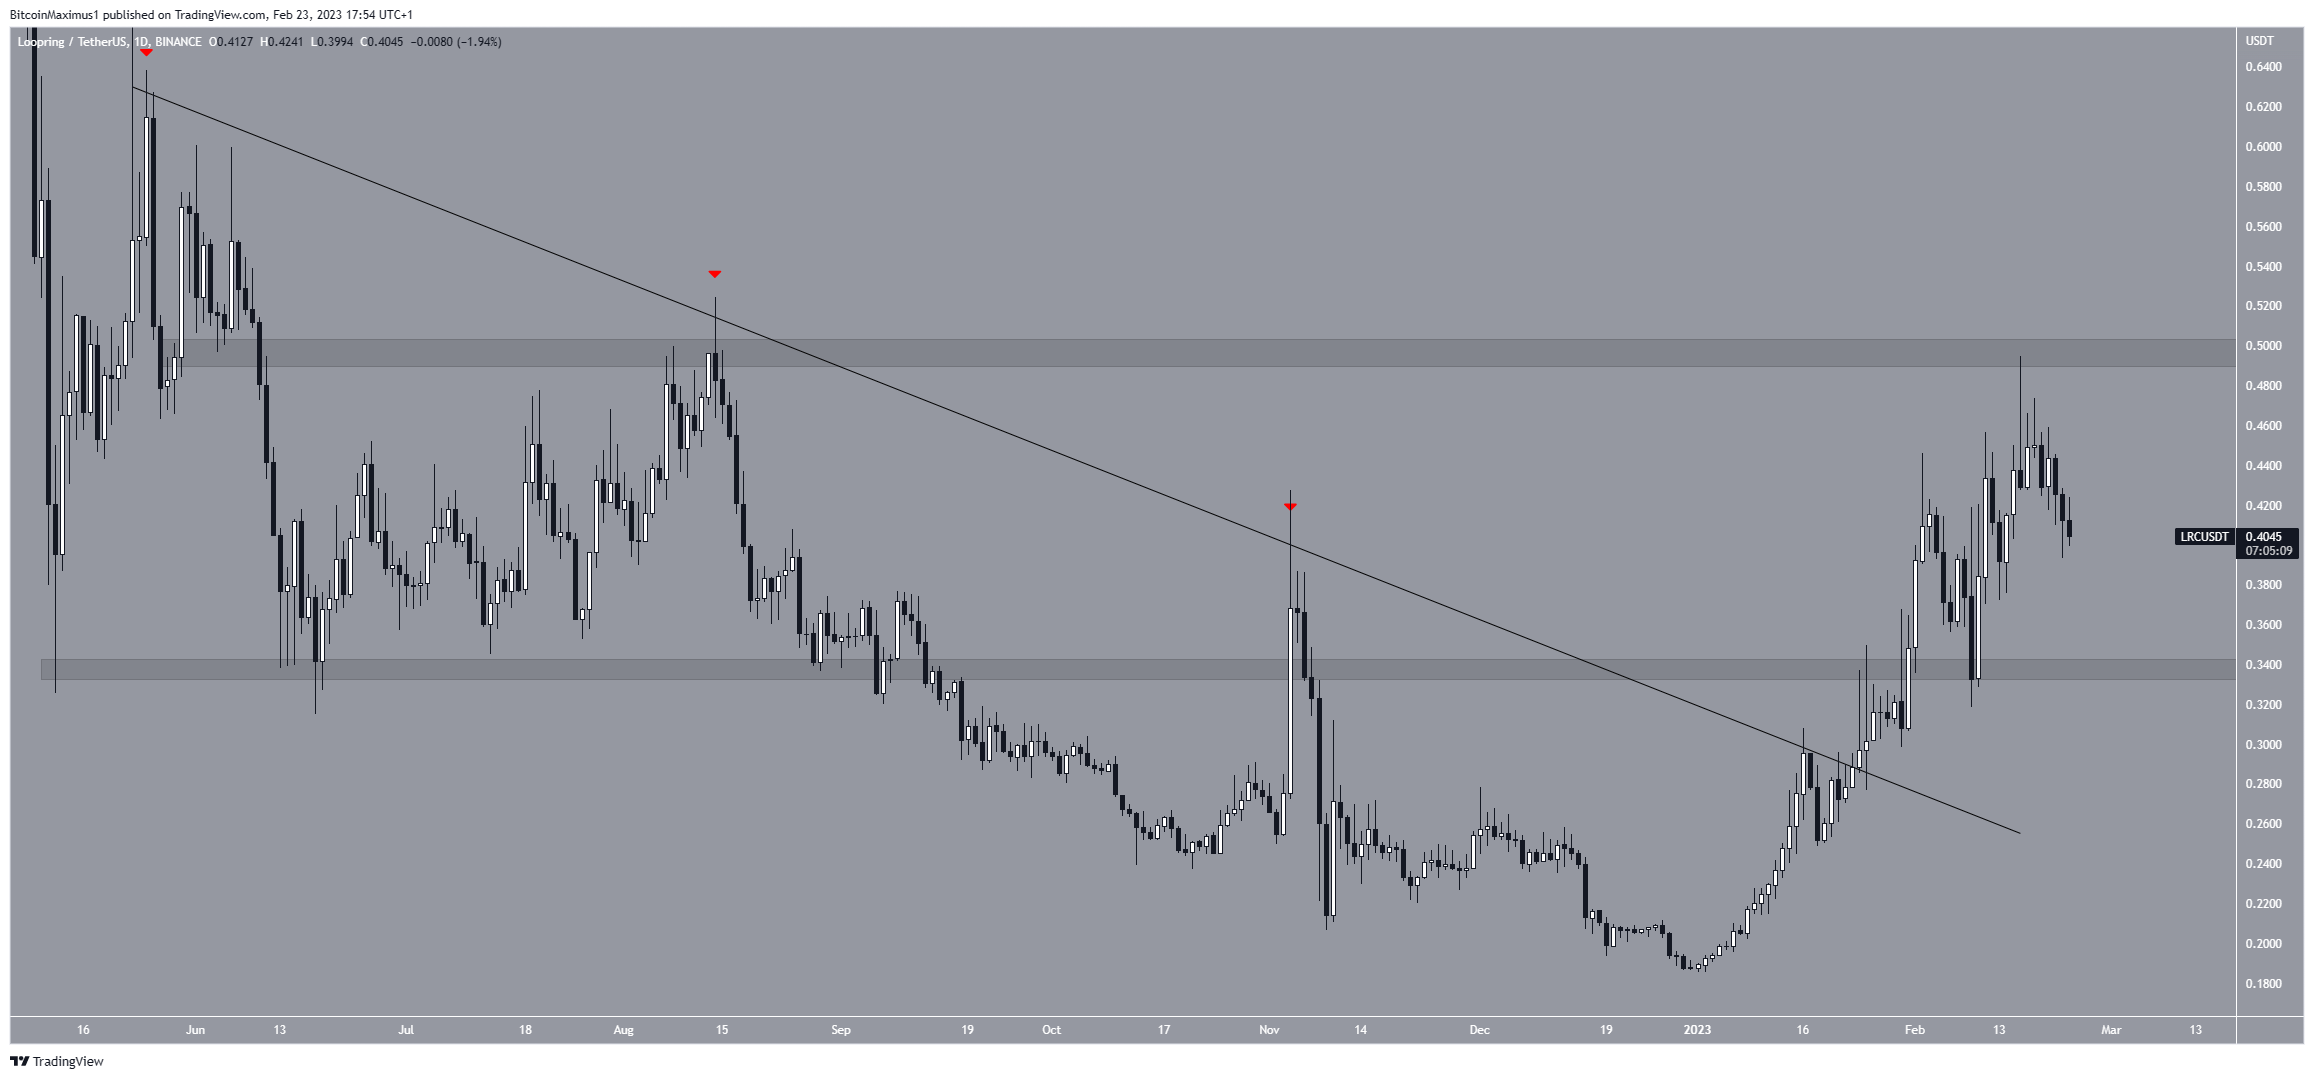
Loopring (LRC) Price Leads Crypto Losers
The LRC price broke out from a descending resistance line on Jan. 23. The increase led to a high of $0.49 on Feb. 16. However, the price created a long upper wick and has fallen since.
Whether the LRC price breaks out above $0.50 or continues to decrease will likely determine the future movement. A breakout could take the price to $0.60, while the continuing of the decrease could cause a fall to $0.33.
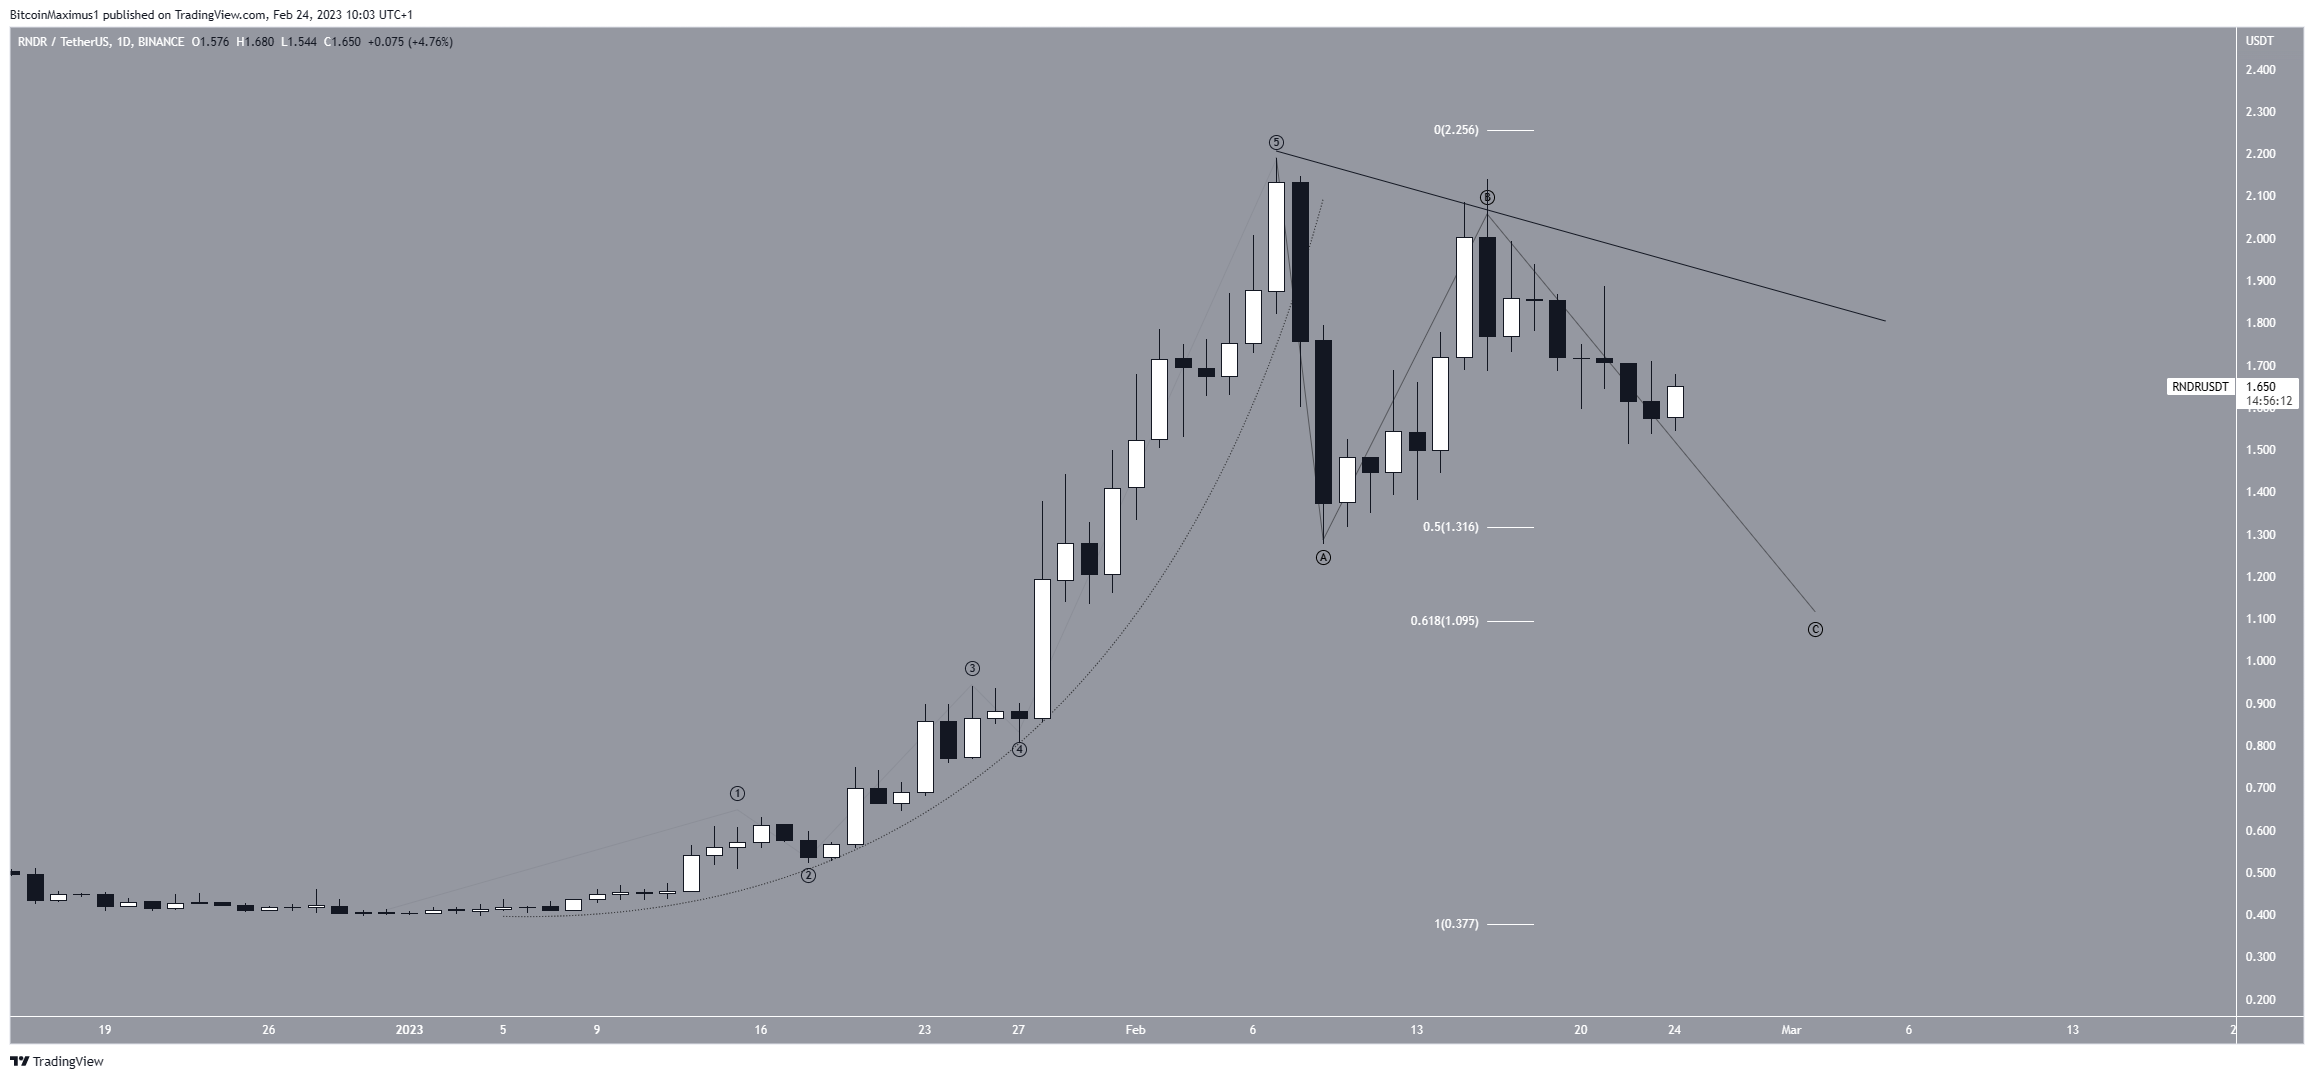
Render Token (RNDR) Breaks Down From Parabola
The RNDR price had increased alongside a parabolic ascending support line since the beginning of the year. The increase led to a high of $2.19 on Feb. 7.
However, the price broke down from the parabola the next day. It is now likely in the C wave of an A-B-C corrective structure. The most likely level for the correction to end would be at the 0.618 Fib retracement support level at $1.09.
However, if the RNDR price breaks out from the current short-term descending resistance line, it could increase to $2.20.
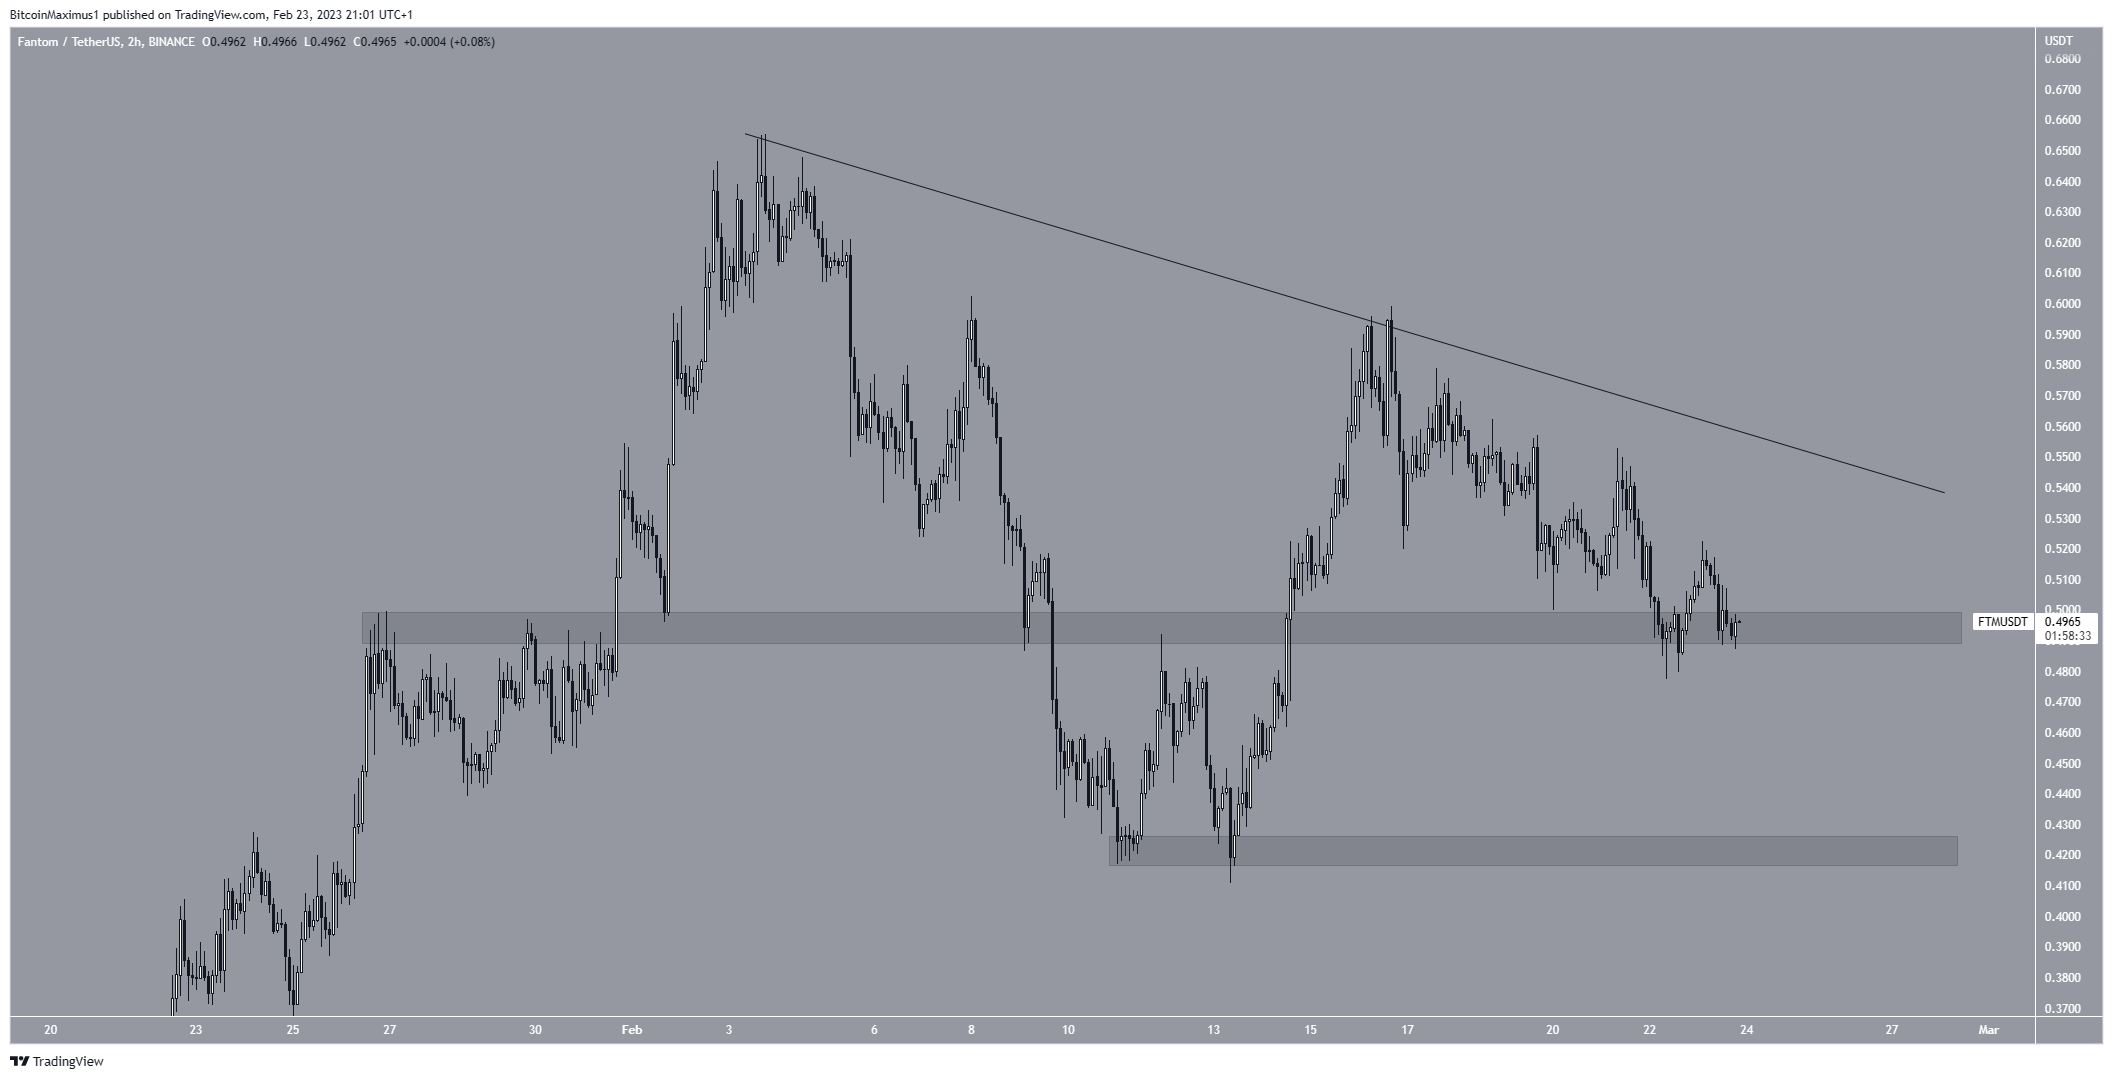
Fantom (FTM) Trades Inside Support
Similar to APT, the FTM price has fallen under a descending resistance line since Feb. 3. More recently, the line caused a rejection on Feb. 16.
The FTM price is currently trading inside the $0.495 support area. Whether it bounces or breaks down could determine the future trend’s direction. A bounce could lead to a retest of the resistance line, while a breakdown could lead to a fall toward $0.420.
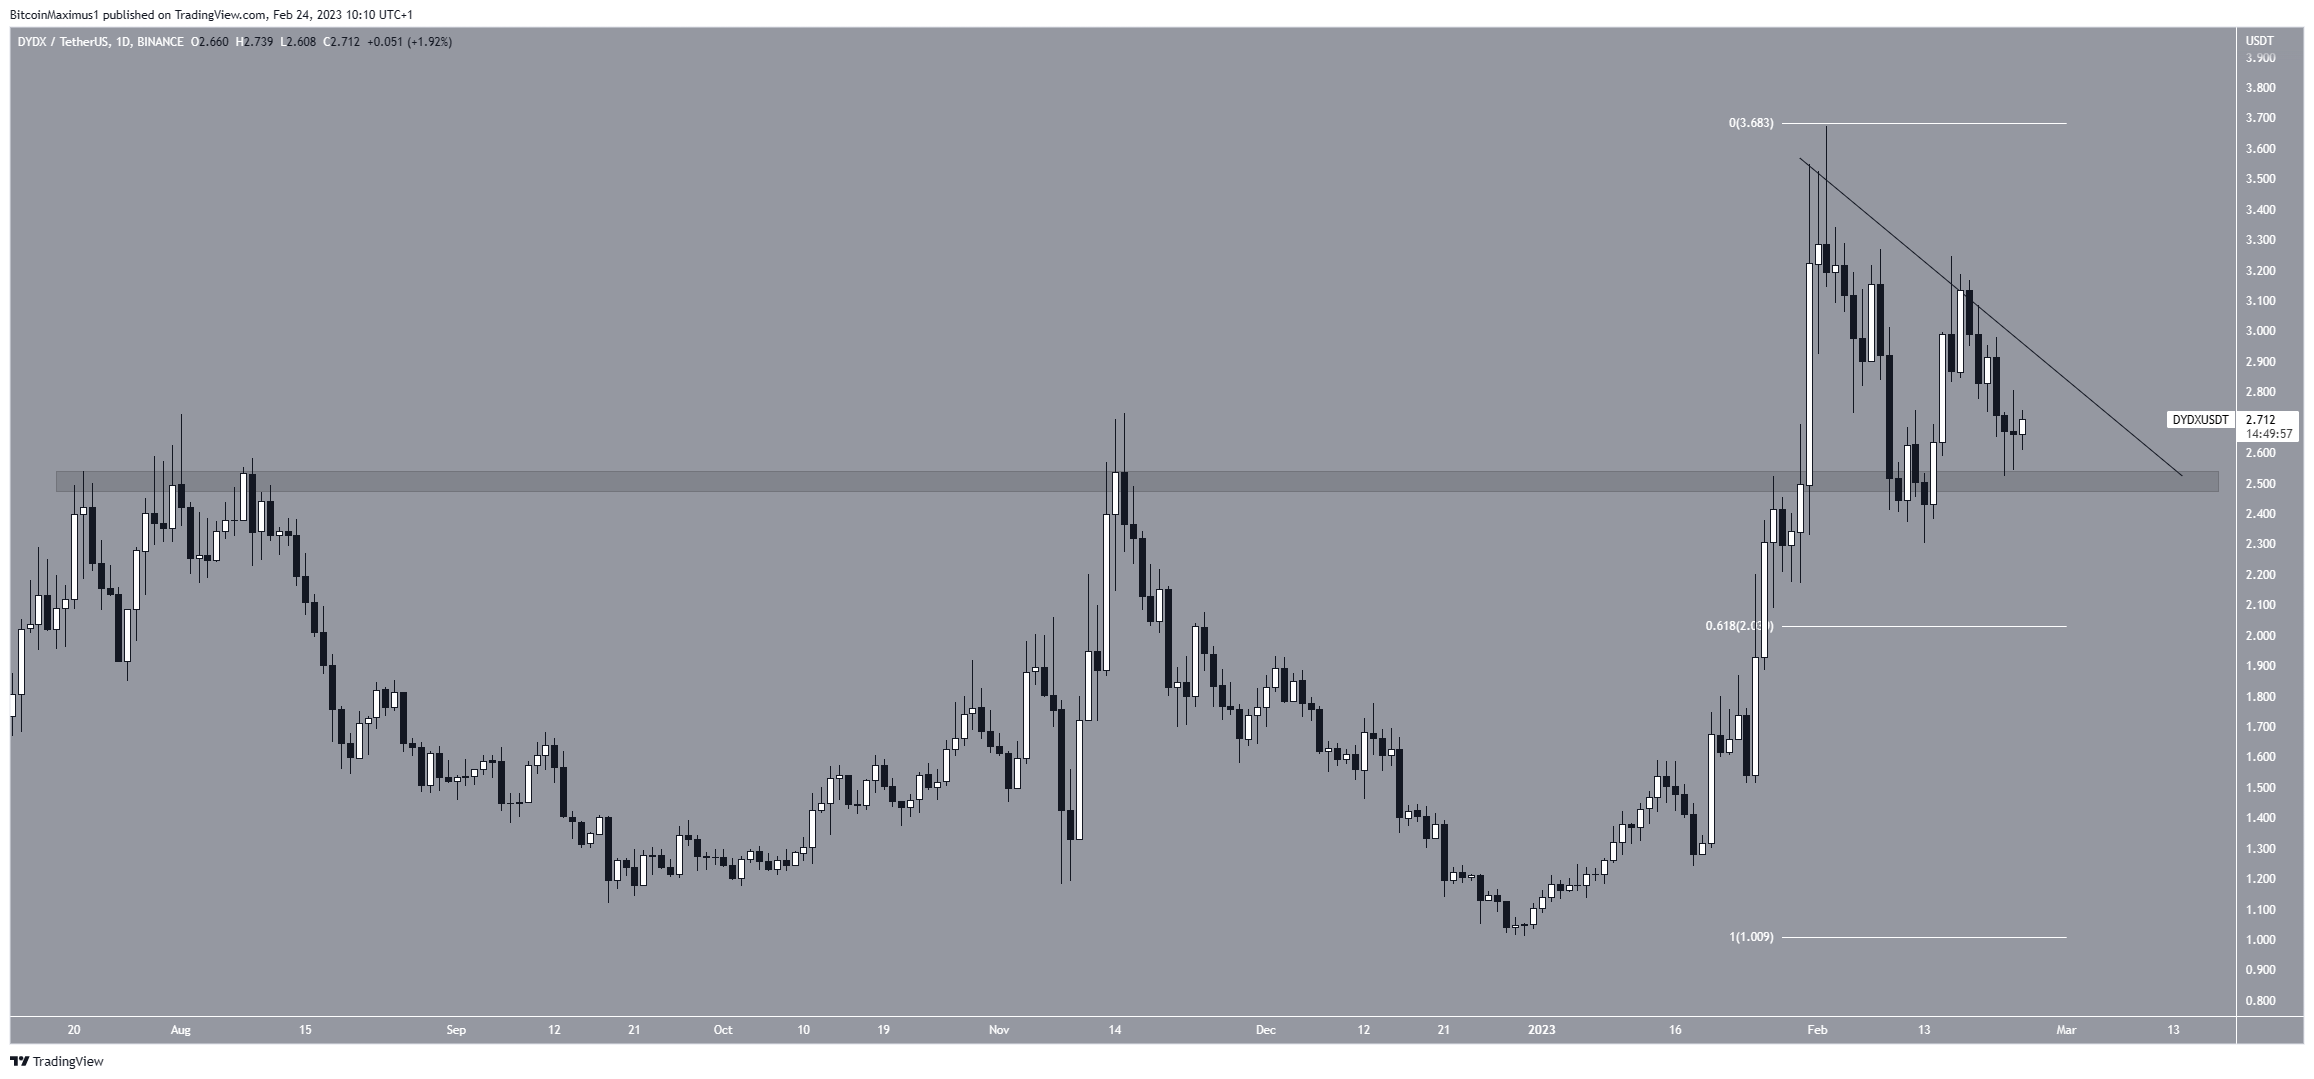
dYdX (DYDX) Bounces at Support
The DYDX price has fallen below a descending resistance line since Jan. 30. The line caused a rejection on Feb. 16.
Currently, the price is trading between the $2.50 horizontal support area and the descending resistance line. If it breaks out from the line, it could increase to $3.50.
However, if it breaks down below $2.50, the price could fall to $2.00.
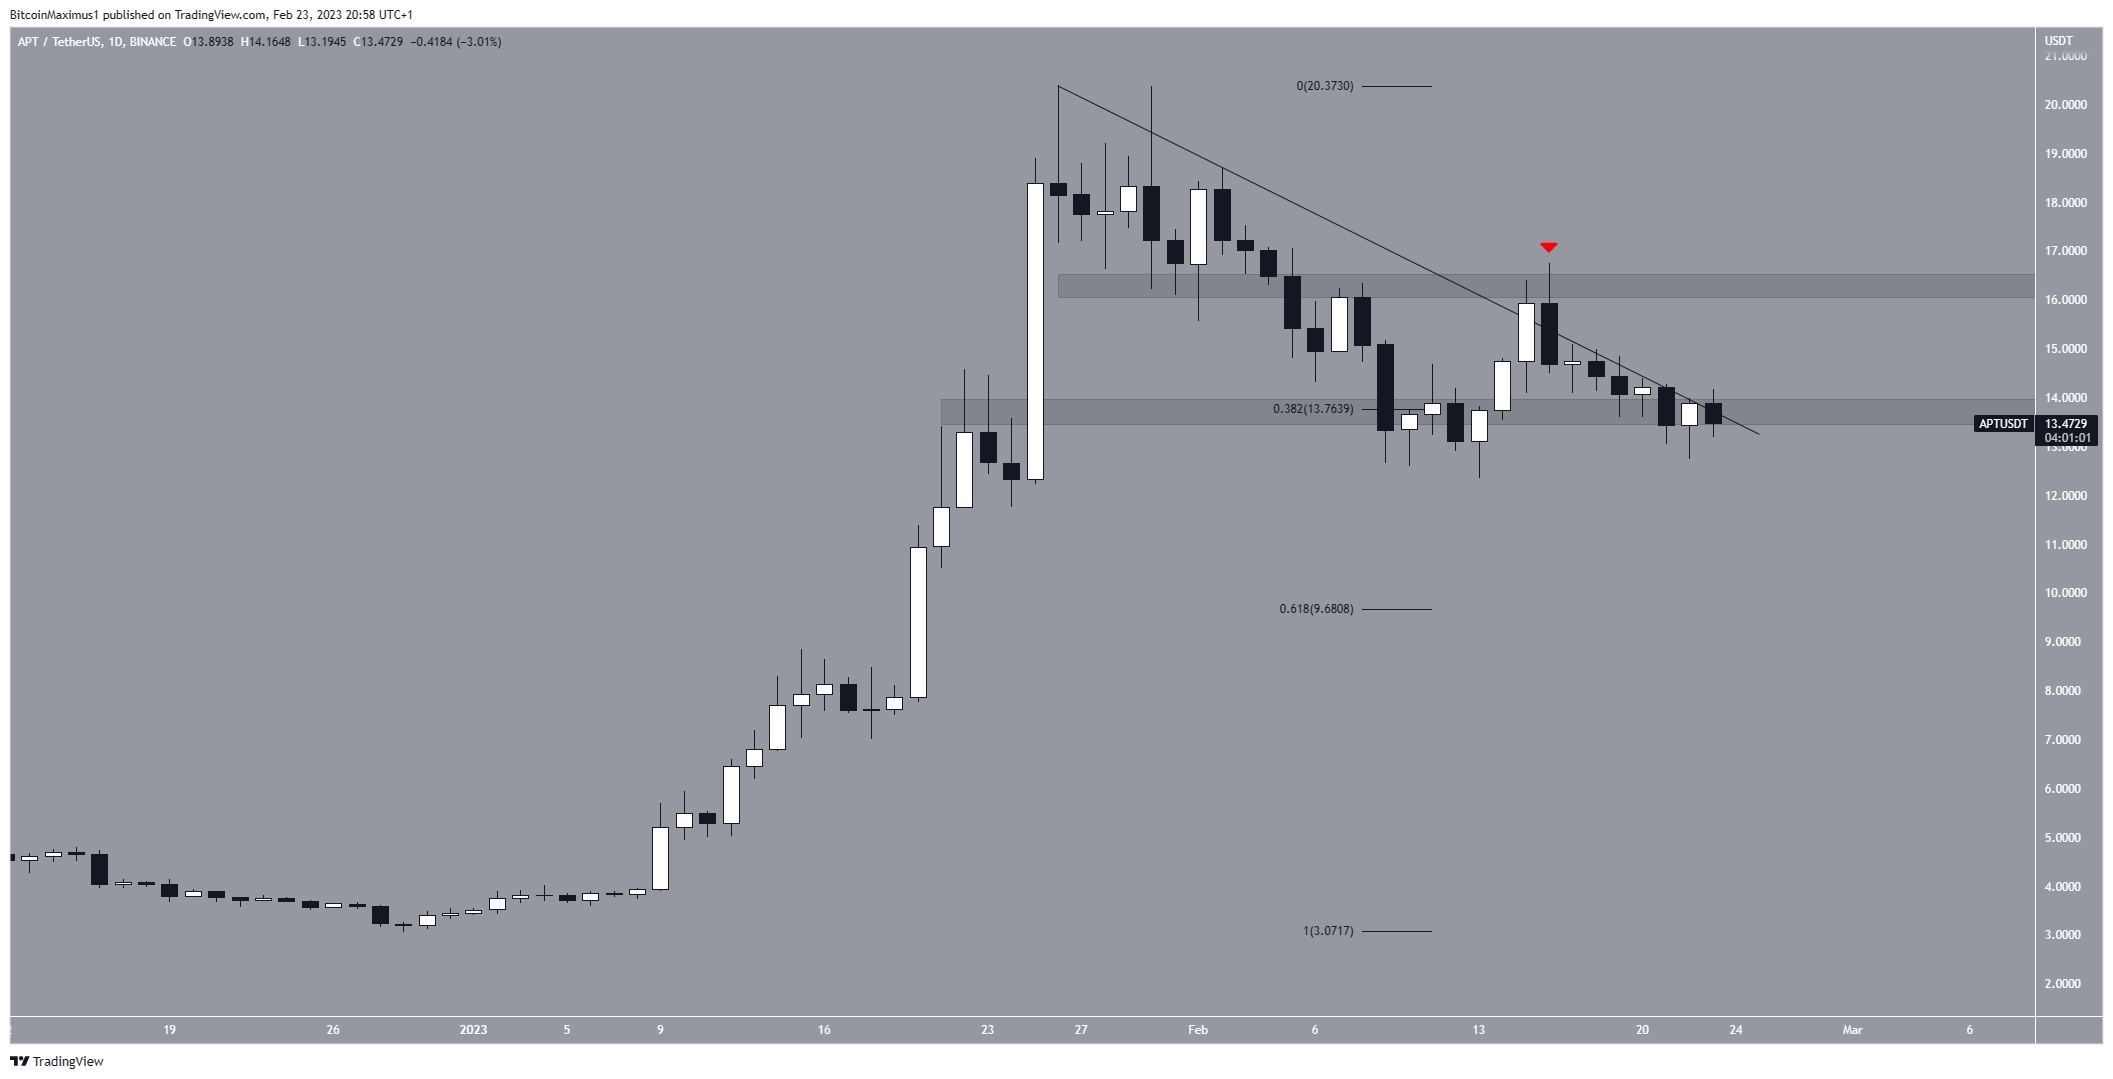
Aptos (APT) Price Follows Resistance Line
The APT price has fallen below a descending resistance line since Jan. 26. The line has caused numerous rejections, most recently on Feb. 16 (red icon).
When combined with the $13.76 support area, the price action creates a descending triangle, which is considered a bearish pattern. As a result, a breakdown from it would be the most likely future price forecast. In that case, the APT price could fall to $9.68.
However, if the price breaks out from the triangle instead, an increase toward $16.50 could follow.
For BeInCrypto’s latest crypto market analysis, click here.
Disclaimer
BeInCrypto strives to provide accurate and up-to-date information, but it will not be responsible for any missing facts or inaccurate information. You comply and understand that you should use any of this information at your own risk. Cryptocurrencies are highly volatile financial assets, so research and make your own financial decisions.
Leave a Reply