

The Dogecoin (DOGE) price is trading below an important confluence of resistances at $0.077-$0.080. Whether it breaks out or gets rejected could determine the future price trend.
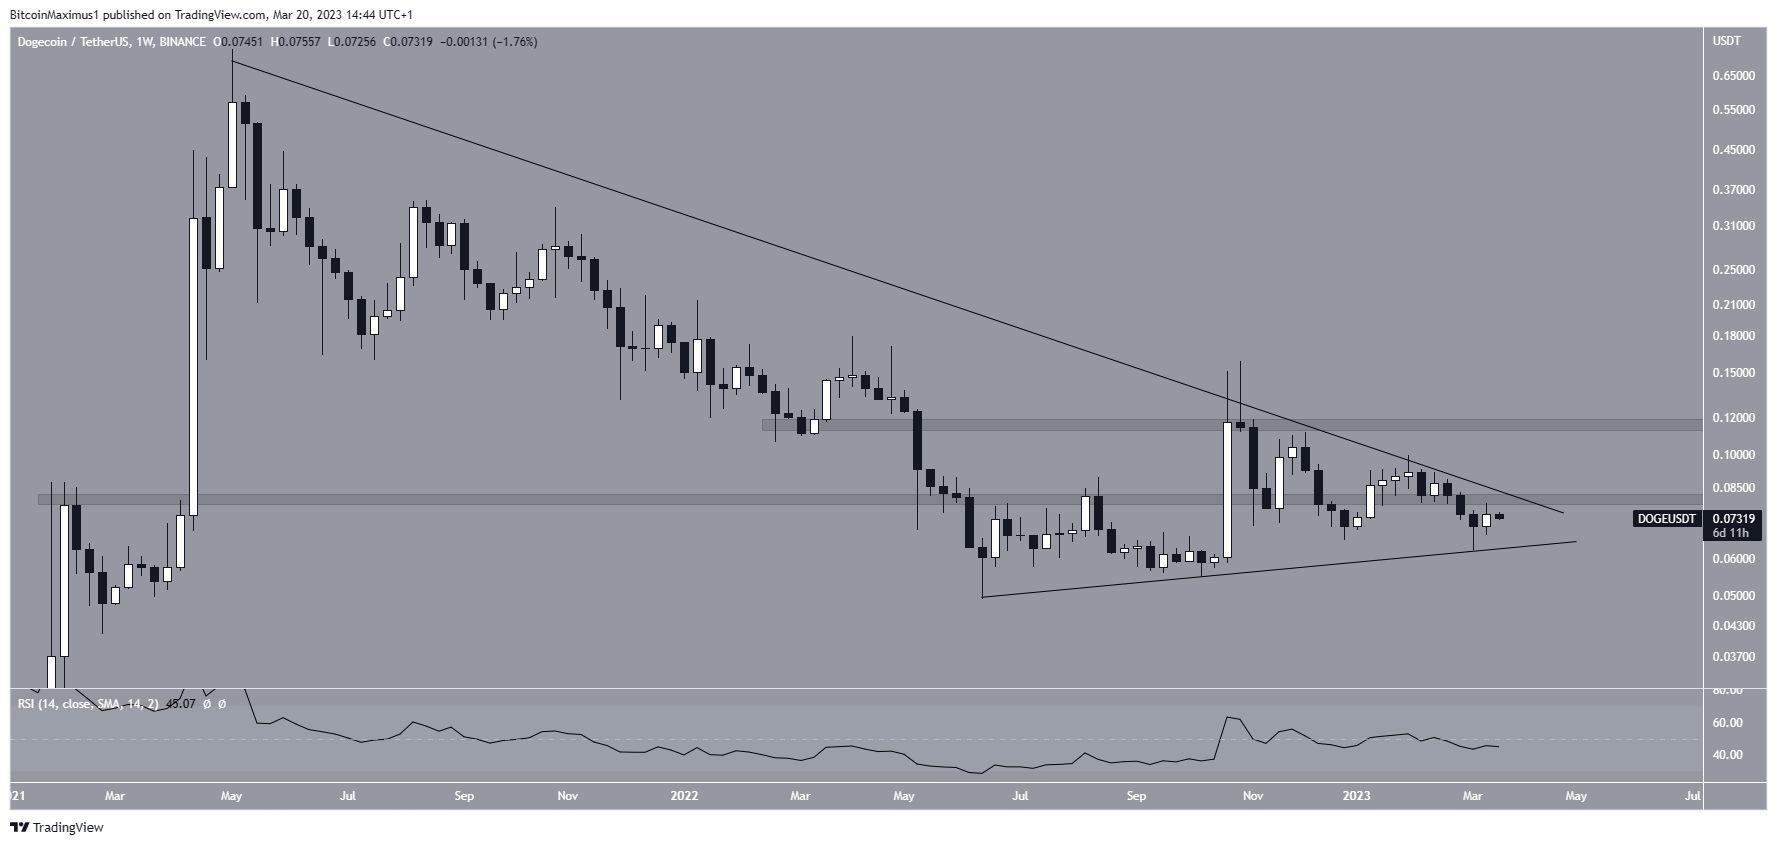
The Dogecoin price has fallen under a long-term descending resistance line since reaching its all-time high price of $0.739. The decrease led to a low of $0.049 in June 2022.
While the price has increased alongside an ascending support line since, it failed to break out from the aforementioned long-term resistance. And the line caused two rejections (red icons).
Moreover, the DOGE price has now fallen below the $0.080 resistance area. This is a very important horizontal level that has intermittently acted as both support and resistance since 2021.
Finally, the weekly RSI is just below 50, a sign of a bearish trend.
As a result, the long-term trend is still undetermined. If the internet meme coin breaks out from the $0.080 area and the resistance line would confirm that the trend is bullish. In that case, an increase to $0.115 could follow.
On the other hand, a breakdown below the ascending support line would indicate that the trend is bearish instead. In that case, a fall toward $0.050 could follow.
Dogecoin (DOGE) Price Trades at Make-or-Break Level
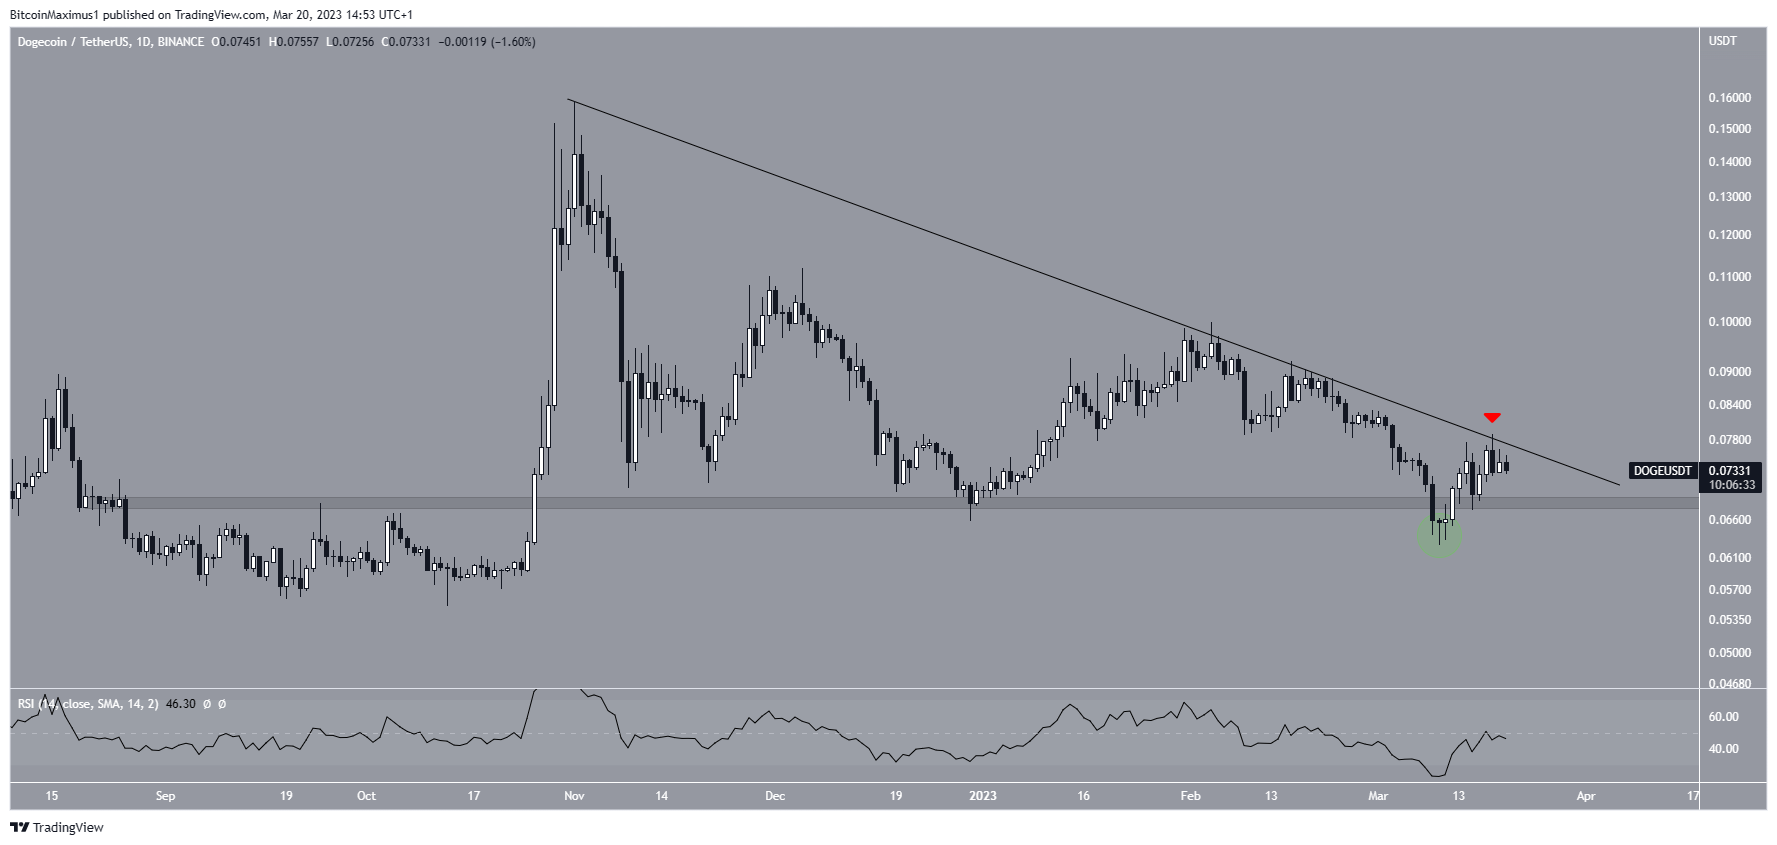
The technical analysis from the daily time frame offers a similarly undecided outlook. The DOGE price has fallen under a shorter-term descending resistance line since November 2022. More recently, the line caused a rejection on February 14, at the highest price of the year, and on March 18 (red icon), creating a bearish engulfing candlestick and initiating the current downward movement. This also coincided with an RSI rejection from the 50 line.
However, the price action also provides a bullish sign. This is given in the form of a deviation (green circle) below the $0.068 horizontal support area. Such deviations often precede upward movements.
Therefore, whether the Dogecoin price breaks out from the resistance line or fall below the $0.068 area instead will likely determine the future trend. In case of a breakout, the price could increase toward the previously outlined $0.115 resistance area. However, if a breakdown occurs, a fall toward at least $0.050 could follow. The next 24 hours could be crucial in determining which move will occur.
To conclude, the future Dogecoin price trend is still undetermined. A breakout above $0.080 could catalyze a sharp upward movement toward $0.115 while a breakdown below $0.068 would lead to a fall toward $0.050.
For BeInCrypto’s latest crypto market analysis, click here.
Disclaimer
BeInCrypto strives to provide accurate and up-to-date information, but it will not be responsible for any missing facts or inaccurate information. You comply and understand that you should use any of this information at your own risk. Cryptocurrencies are highly volatile financial assets, so research and make your own financial decisions.
Leave a Reply