

The BNB price has decreased since April 2023, when the $350 horizontal resistance area rejected it.
While the weekly timeframe readings are decisively bearish, a bullish pattern in the daily timeframe could trigger a significant upward movement.
BNB Falls Inside Range Low
The technical analysis from the weekly timeframe shows that the BNB price is trading inside the $210 horizontal support area, which has been in place for 930 days. BNB bounced inside the area in August (green icon) but failed to sustain its increase, falling back inside the area this week.
The BNB price has also faced resistance from the $350 horizontal area. More recently, the price created lower highs in Nov. 2022 and May 2023 (red icons), catalyzing the decrease towards the $210 horizontal area.
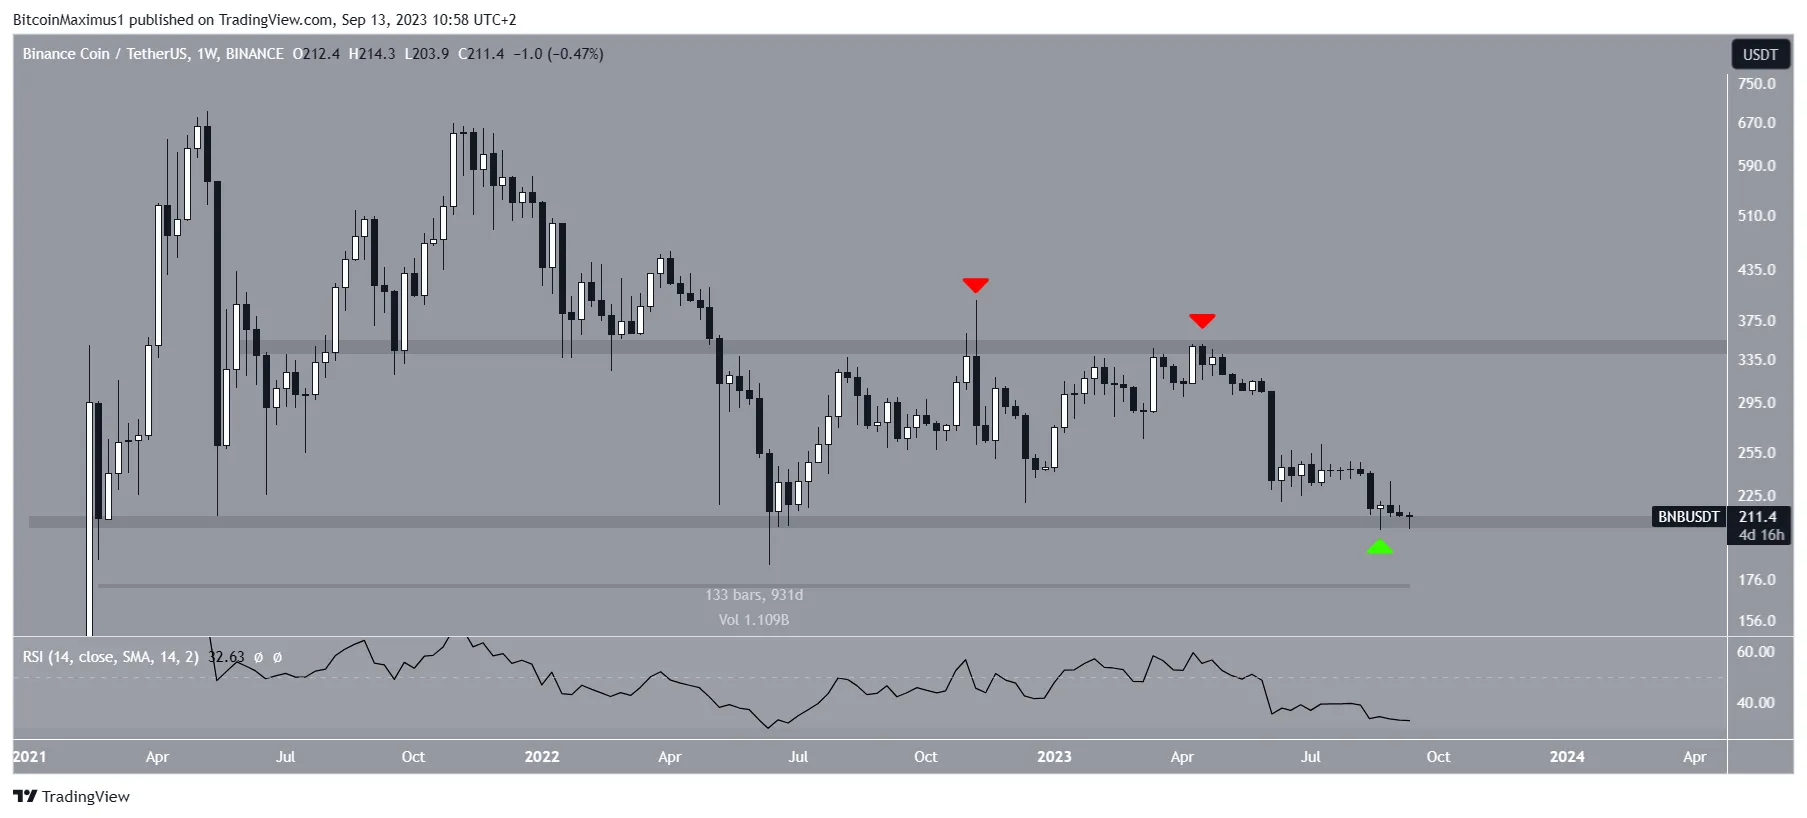
The weekly RSI is decisively bearish. The Relative Strength Index (RSI) is a popular momentum indicator traders use to assess various aspects of a market’s condition. The RSI is a valuable tool for assessing whether a market is overbought or oversold and for gauging the strength and direction of a trend
Readings above 50 and an upward trend suggest that bulls still have an advantage, while readings below 50 indicate the opposite. The indicator is below 50 and falling, both signs of a bearish trend. Furthermore, no bullish divergence is developing, which could initiate a bullish trend reversal.
News surrounding the Binance exchange is mostly negative. Binance.US CEO Brian Shroder has left the company, eliminating 100 positions due to regulatory pressures. Despite this setback, Binance CEO Changpeng Zhao reassured its users that the trading platform is stable and has liquidity.
BNB Price Prediction: Will Double Bottom Initiate Reversal?
The technical analysis from the daily time frame is more bullish than the weekly one. The main reason for this is the creation of a double bottom, considered a bullish pattern.
The double bottom has also been combined with a bullish divergence in the RSI. This is a bullish development in which a momentum increase accompanies a price decrease. It often leads to upward movements.
The fact that it is combined with a bullish pattern further increases the likelihood that it will lead to an upward movement.
If it does, the BNB price can increase by 20% and reach the $255 resistance area.
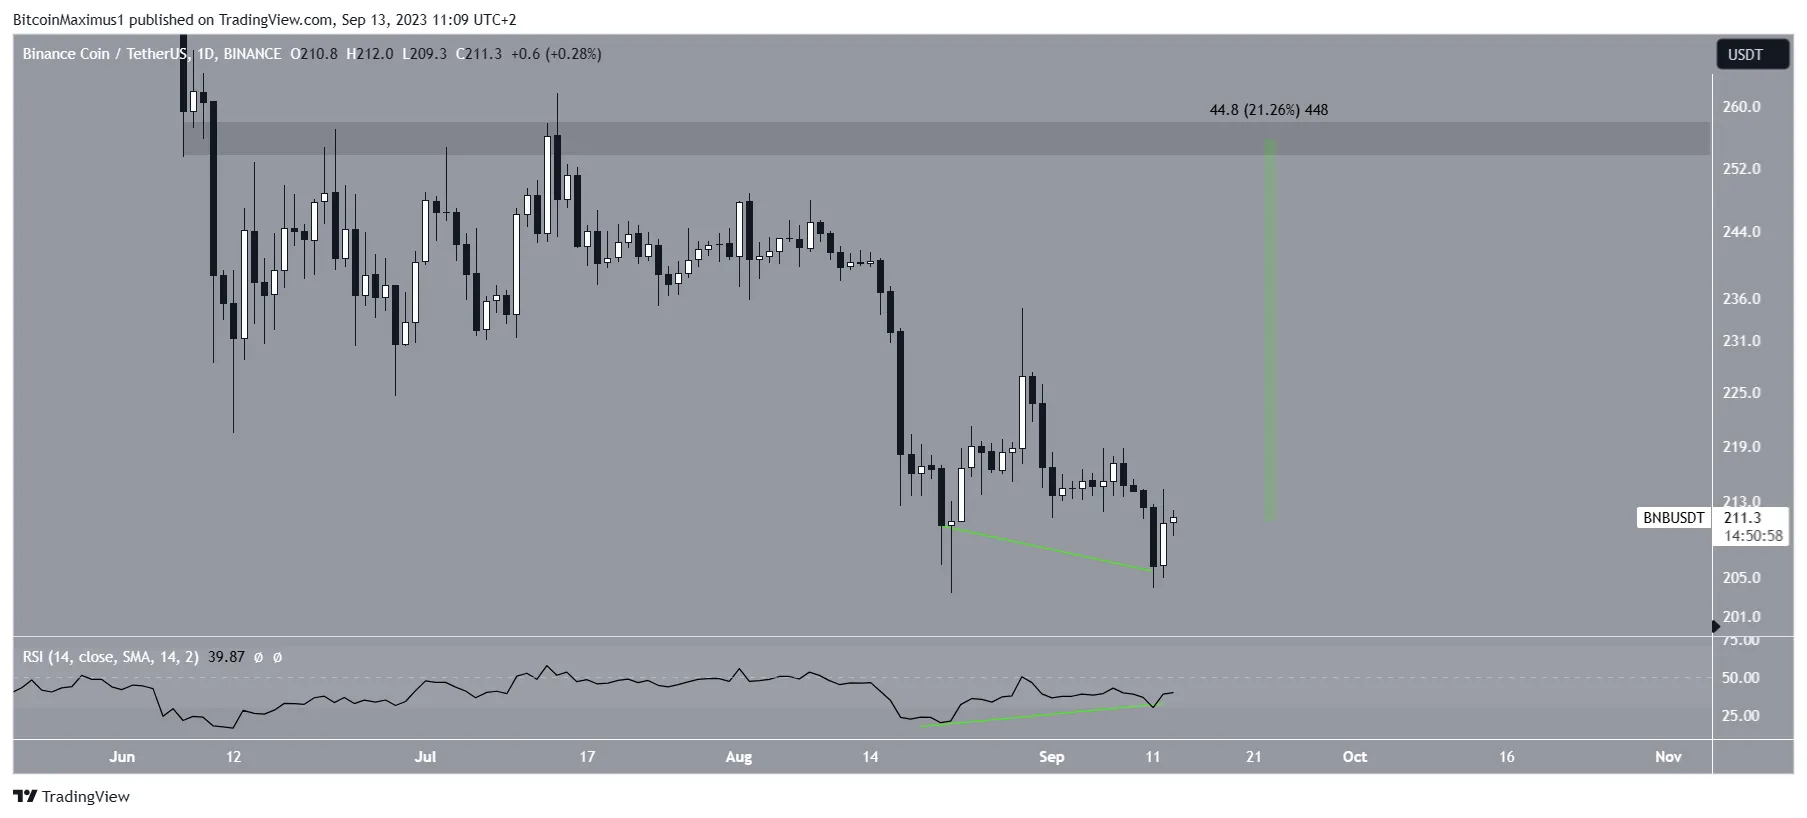
Despite this bullish short-term BNB price prediction, a close below the $210 horizontal area will invalidate the double-bottom pattern. In that case, a 20% drop to $170 will likely be the future price outlook.
For BeInCrypto’s latest crypto market analysis, click here
Disclaimer
In line with the Trust Project guidelines, this price analysis article is for informational purposes only and should not be considered financial or investment advice. BeInCrypto is committed to accurate, unbiased reporting, but market conditions are subject to change without notice. Always conduct your own research and consult with a professional before making any financial decisions.
Leave a Reply