

The BNB price trades inside the long-term horizontal support area at $210.
The price has created a bullish double-bottom pattern but still trades below a descending resistance trendline.
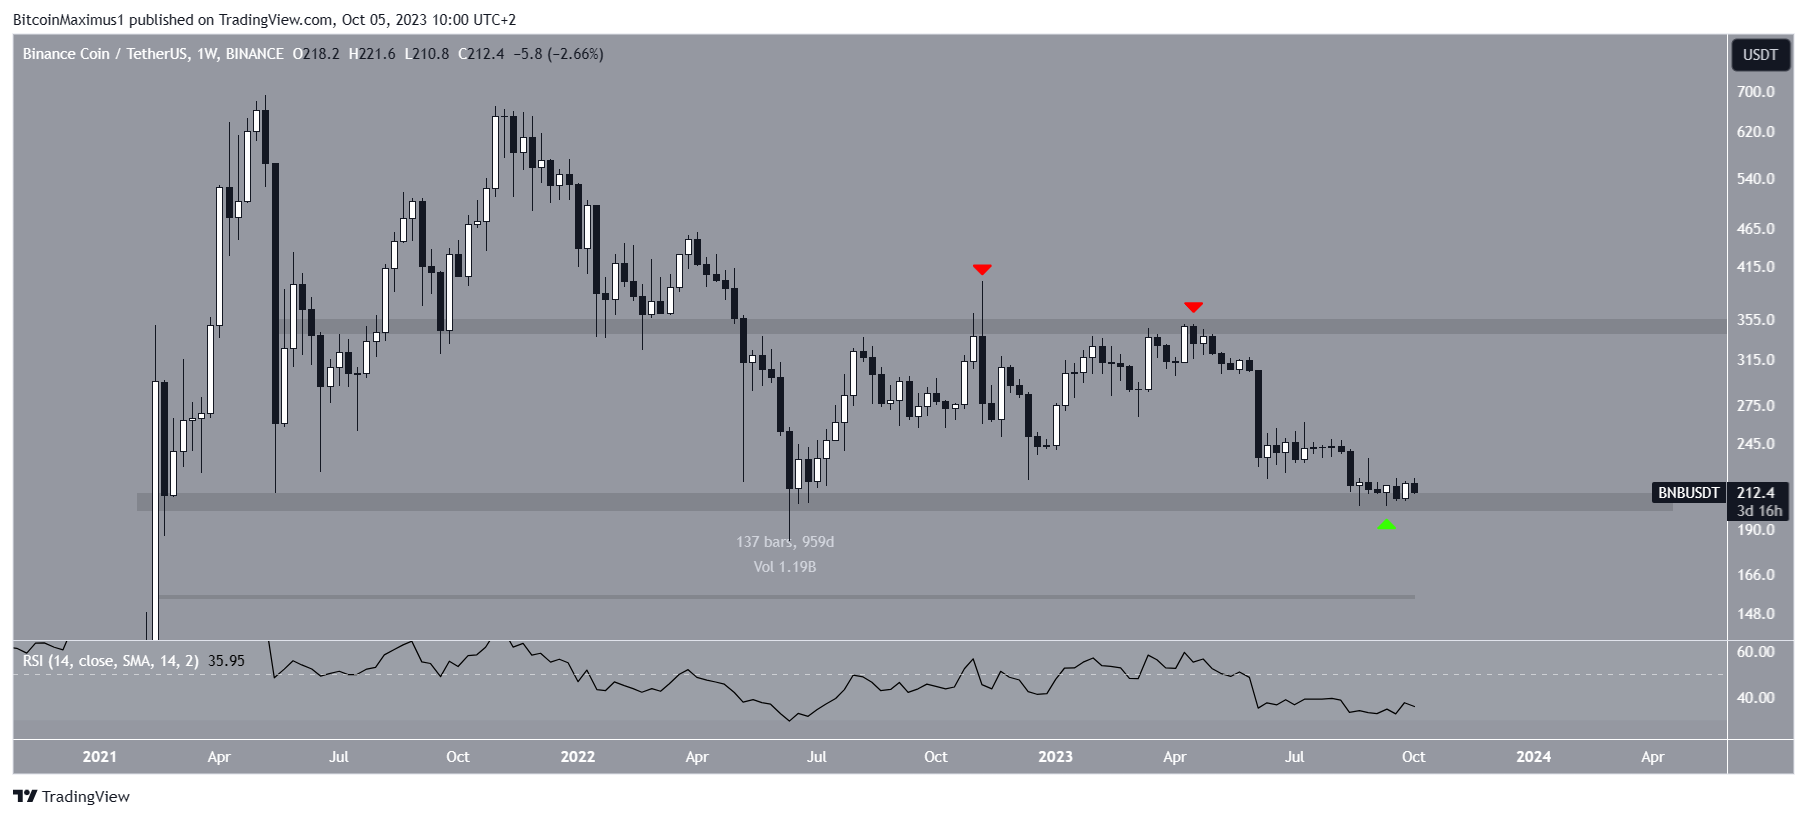
BNB Consolidates Close-to-Range Low
The weekly timeframe technical analysis for BNB shows that the price trades inside the long-term $210 horizontal support area. The area has been in place for 960 days so far.
More recently, the altcoin bounced inside the area during the week of September 11-18 (green icon).
During this time, the BNB price has faced resistance at $350. The horizontal area has been validated several times (red icons), most recently in April.
This rejection catalyzed the downward movement of BNB to the horizontal support area at $210.
The weekly RSI gives a bearish reading. With the RSI as a momentum indicator, traders can determine whether a market is overbought or oversold and decide whether to accumulate or sell an asset.
Bulls have an advantage if the RSI reading is above 50 and the trend is upward, but if the reading is below 50, the opposite is true.
The RSI is below 50 and falling, both signs of a bearish trend.
News surrounding the Binance exchange is mixed. Binance CEO Changpeng Zhao is facing a lawsuit due to his alleged use of Twitter to hurt FTX.
However, Binance also plans on opening a crypto exchange in Thailand and has resumed services in Belgium after a three-month hiatus.
BNB Price Prediction: Can Bullish Pattern Initiate Increase?
The daily time frame technical analysis gives a more bullish outlook for BNB when compared to the weekly one.
The main reason for this is creating a double bottom pattern between August 22 and September 11 (green icons). The double-bottom is a bullish pattern, meaning that it usually leads to breakouts.
Furthermore, the BNB price pattern was combined with a bullish divergence in the RSI. A bullish divergence occurs when a momentum increase accompanies a price decrease. It often signals the beginning of a bullish trend reversal.
Despite these bullish signs, the cryptocurrency has not yet broken out from a descending resistance trendline. It has to do so to confirm the bullish trend reversal.
If a breakout happens, it will likely lead to a 25% increase to the $255 horizontal resistance area.
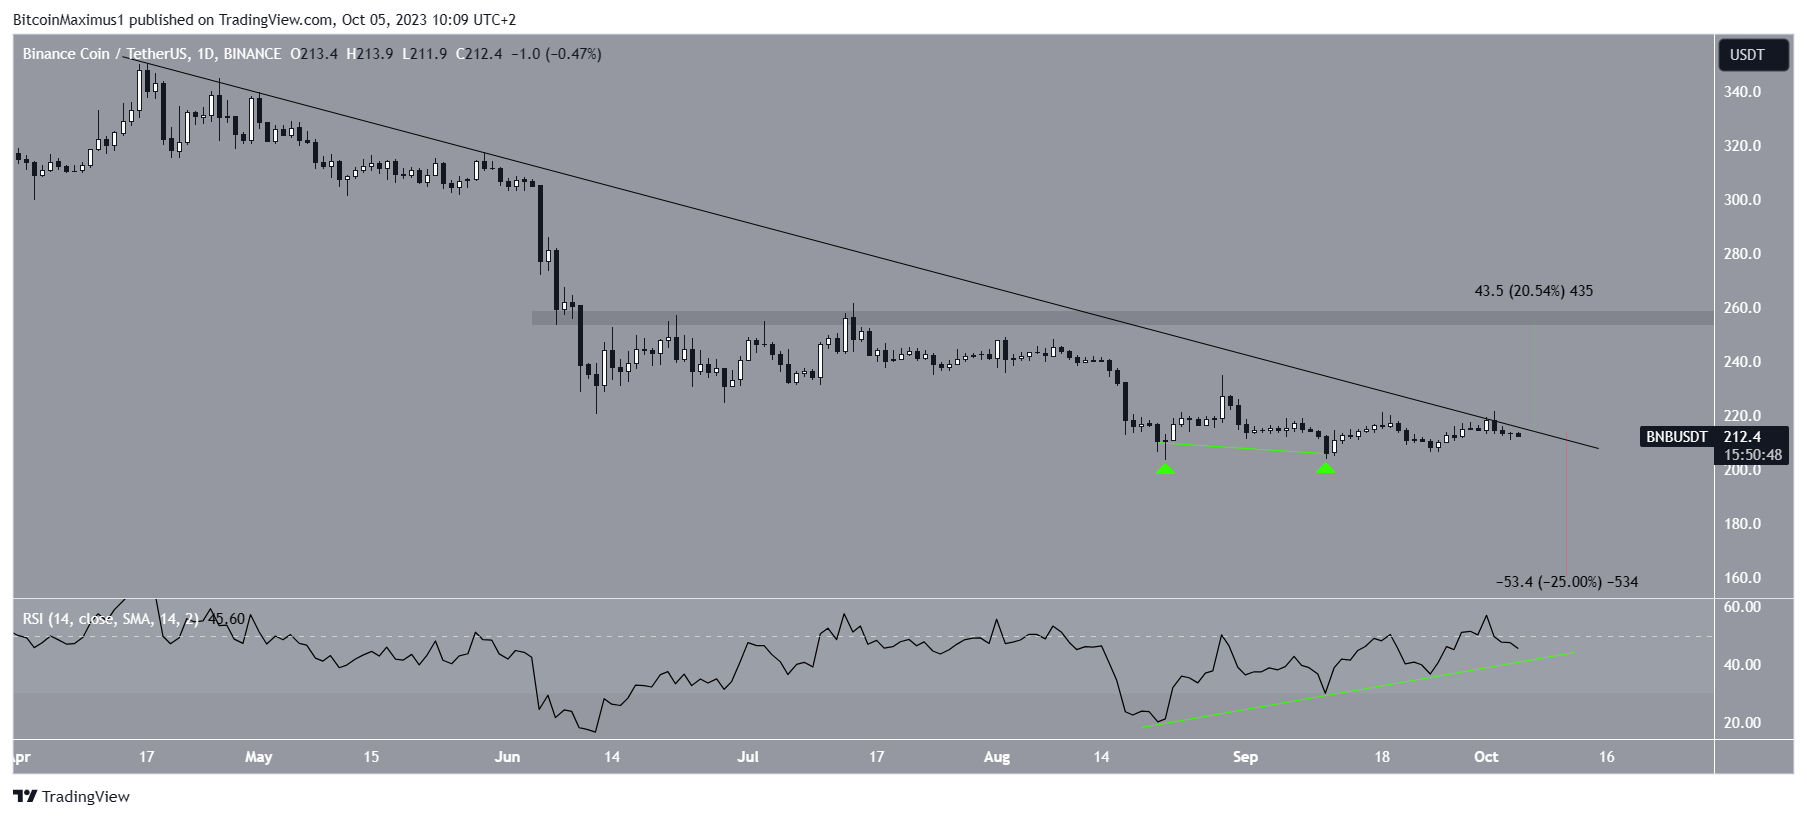
Despite this bullish short-term BNB price prediction, a close below the $210 horizontal area will invalidate the double-bottom pattern.
If that occurs, a 25% drop to the $160 support area will likely be the future price forecast.
For BeInCrypto’s latest crypto market analysis, click here
Disclaimer
In line with the Trust Project guidelines, this price analysis article is for informational purposes only and should not be considered financial or investment advice. BeInCrypto is committed to accurate, unbiased reporting, but market conditions are subject to change without notice. Always conduct your own research and consult with a professional before making any financial decisions.
Leave a Reply