
The Ethereum (ETH) price has bounced at a nearly 500-day ascending support trendline.
Ethereum broke out above a shorter-term descending resistance trendline shortly after the bounce.
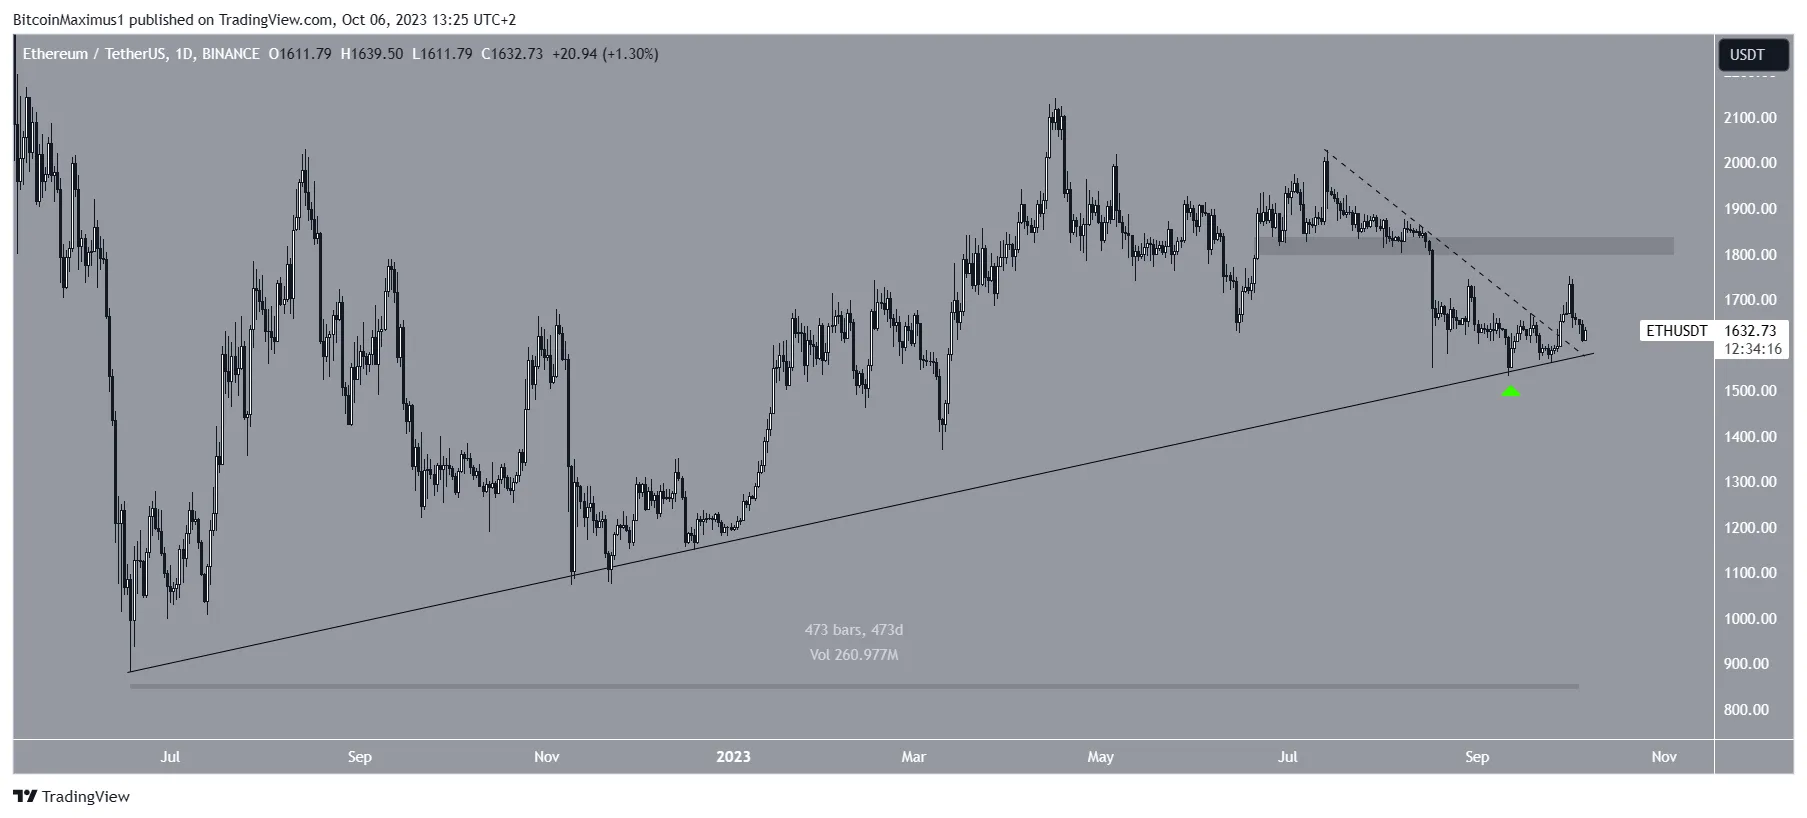
Ethereum Bounces at Nearly 500-Day Support
The daily time frame chart shows that the ETH price has increased since September 11. At the time, it bounced (green icon) at a long-term ascending support trendline, which has been in place for 473 days.
Crypto investing, simplified. Get Ethereum (ETH) price predictions here.
After creating a higher low, the ETH price broke out from a shorter-term descending resistance trendline on September 28. The breakout led to a high of $1,751 on October 1.
However, the price has fallen in the days since. A similar decrease has been seen in the rest of the crypto market.
After the price clears an important trendline, it sometimes returns to validate it as support before resuming its previous movement, as has been the case for ETH so far.
News for the Ethereum network is mixed. On October 2, nine Ethereum futures Exchange-Traded Funds (ETF) went live in the United States. However, these funds amassed less than $2 million in volume, underwhelming market speculators.
Also, Grayscale has filed an application with the Securities and Exchange Commission (SEC) to convert its Ethereum trust to an Ethereum ETF. Finally, Ethereum’s founder, Vitalik Buterin, highlighted the concerns and benefits of adding more features to the core Ethereum software.
ETH Price Prediction: What’s Next for Price?
A closer look at the ETH price movement shows that the Ethereum price bounce was preceded by a significant bullish divergence (green line) in the RSI.
Market traders use the RSI as a momentum indicator to identify overbought or oversold conditions and to decide whether to accumulate or sell an asset.
Readings above 50 and an upward trend indicate that bulls still have an advantage, whereas readings below 50 suggest the opposite.
A bullish divergence occurs when a momentum increase accompanies a price decrease. It often leads to bullish trend reversals, as has been the case with Ethereum so far.
If the increase continues, ETH can reach the next resistance at $1,820, 11% above the current price.
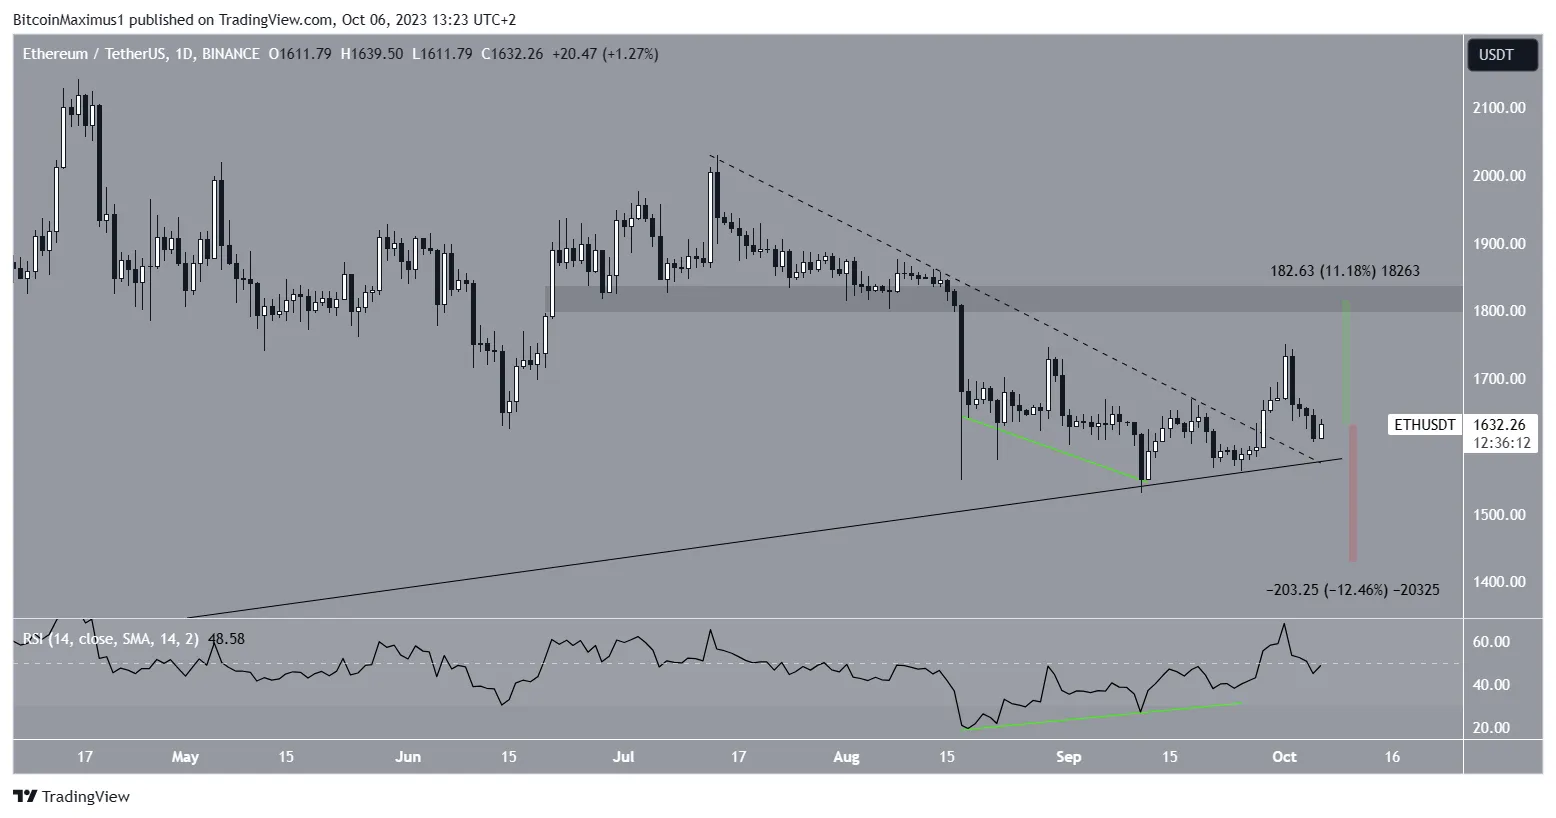
Despite this bullish ETH price prediction, a close below the long-term ascending support line will invalidate the bullish structure.
In that case, ETH could fall by 12% to the next long-term support at $1,430.
For BeInCrypto’s latest crypto market analysis, click here.
Disclaimer
In line with the Trust Project guidelines, this price analysis article is for informational purposes only and should not be considered financial or investment advice. BeInCrypto is committed to accurate, unbiased reporting, but market conditions are subject to change without notice. Always conduct your own research and consult with a professional before making any financial decisions.
Leave a Reply