

The Litecoin (LTC) price has fallen by 50% since reaching its yearly high of $115 in July.
The price is trading above the long-term $63 horizontal support area and has broken out from a descending resistance trendline.
Litecoin Returns to Long-Term Range Low
The technical analysis for the weekly timeframe shows that Litecoin had decreased since July, when it reached a new yearly high of $115.
The downward movement caused a breakdown from an ascending support trendline and led to a low of $56 in August. This was a 50% decrease from the high.
Since the low, the cryptocurrency has traded just above the $63 horizontal area. It initially bounced immediately after the low, creating a long lower wick (black icon). This is considered a sign that buyers are taking over, not allowing sellers to push the price down.
Litecoin created two more bullish candlesticks in September (green icons). The fact that the candlesticks appear at the $63 horizontal area further increases its significance. However, the LTC price is at risk of creating a bearish candlestick this week.
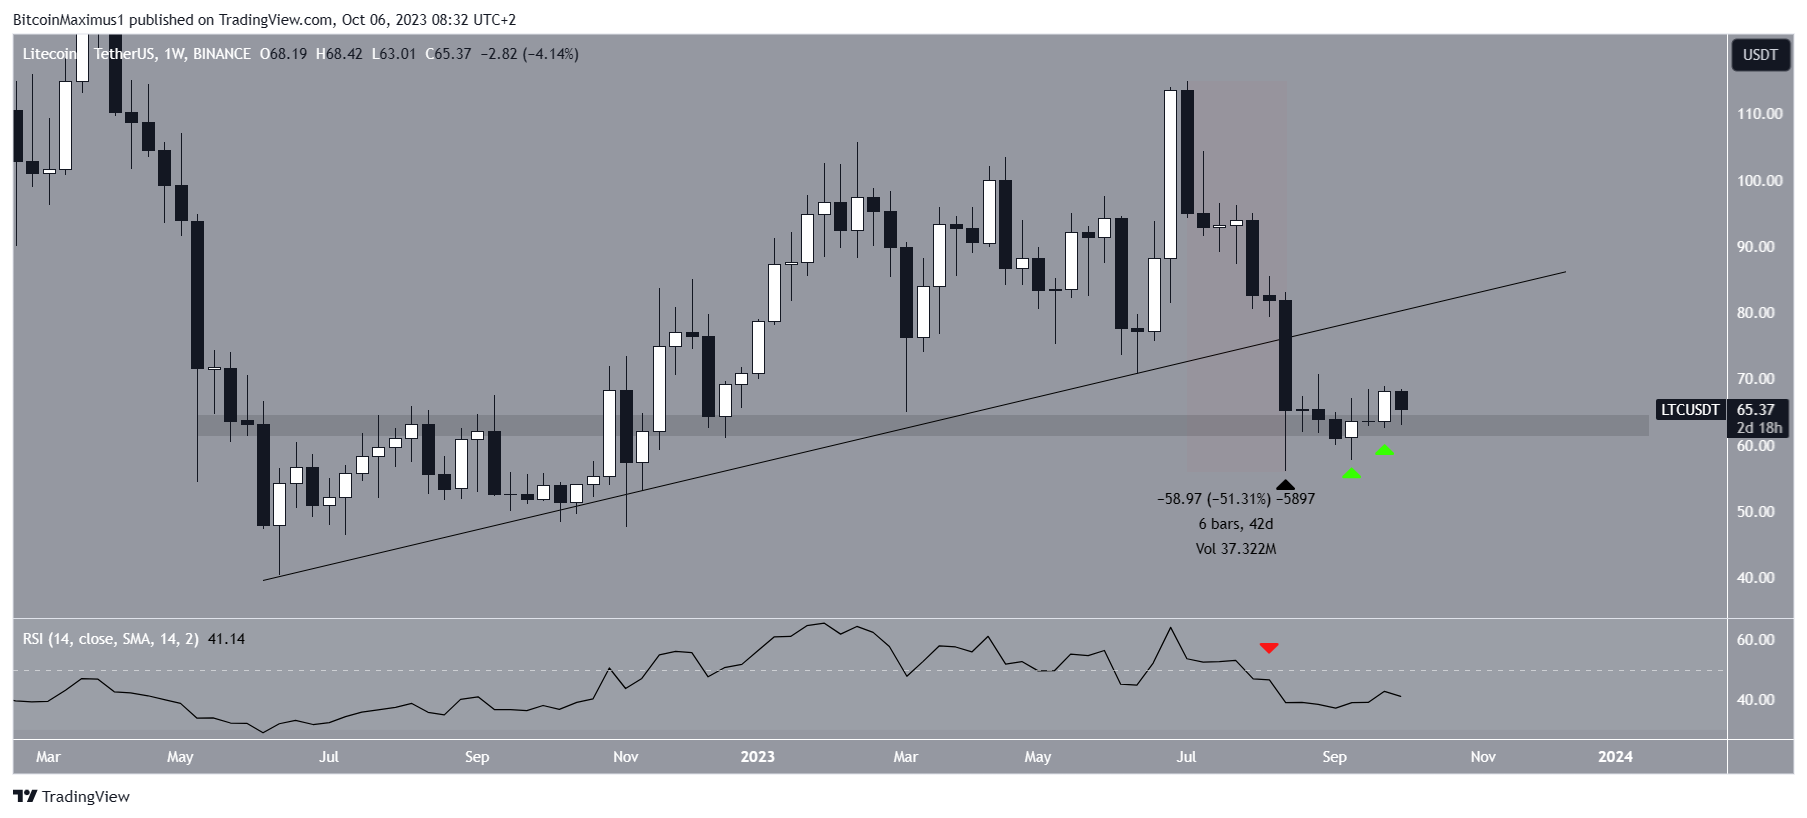
Besides the potential for a bearish candlestick this week, the weekly RSI is also bearish.
Traders use the RSI as a momentum indicator to assess whether a market is overbought or oversold and to determine whether to accumulate or sell an asset.
If the RSI reading is above 50 and the trend is upward, bulls still have an advantage, but if the reading is below 50, the opposite is true.
The RSI is below 50 (red icon) and falling, both signs of a bearish trend.
Litecoin Price Prediction: Will a Breakout Occur?
The daily timeframe price action provides a mixed reading.
LTC fell below the $68 resistance area on the bearish side after deviating above it (red circle). Such deviations are considered bearish signs since buyers could not sustain the increase.
On the bullish side, the altcoin broke out from a descending resistance trendline on September 15. Since the trendline had been in place for 74 days, its breakout is a sign that the previous correction is complete.
While the price action is mixed, the daily RSI is bullish. Before the breakout, the indicator generated a bullish divergence (green line). A bullish divergence occurs when a momentum increase accompanies a price decrease. It often leads to bullish trend reversals.
Due to the RSI, a Litecoin price breakout above the $68 resistance area is slightly more likely. If this occurs, a 28% increase to the next resistance at $85 will be the most likely.
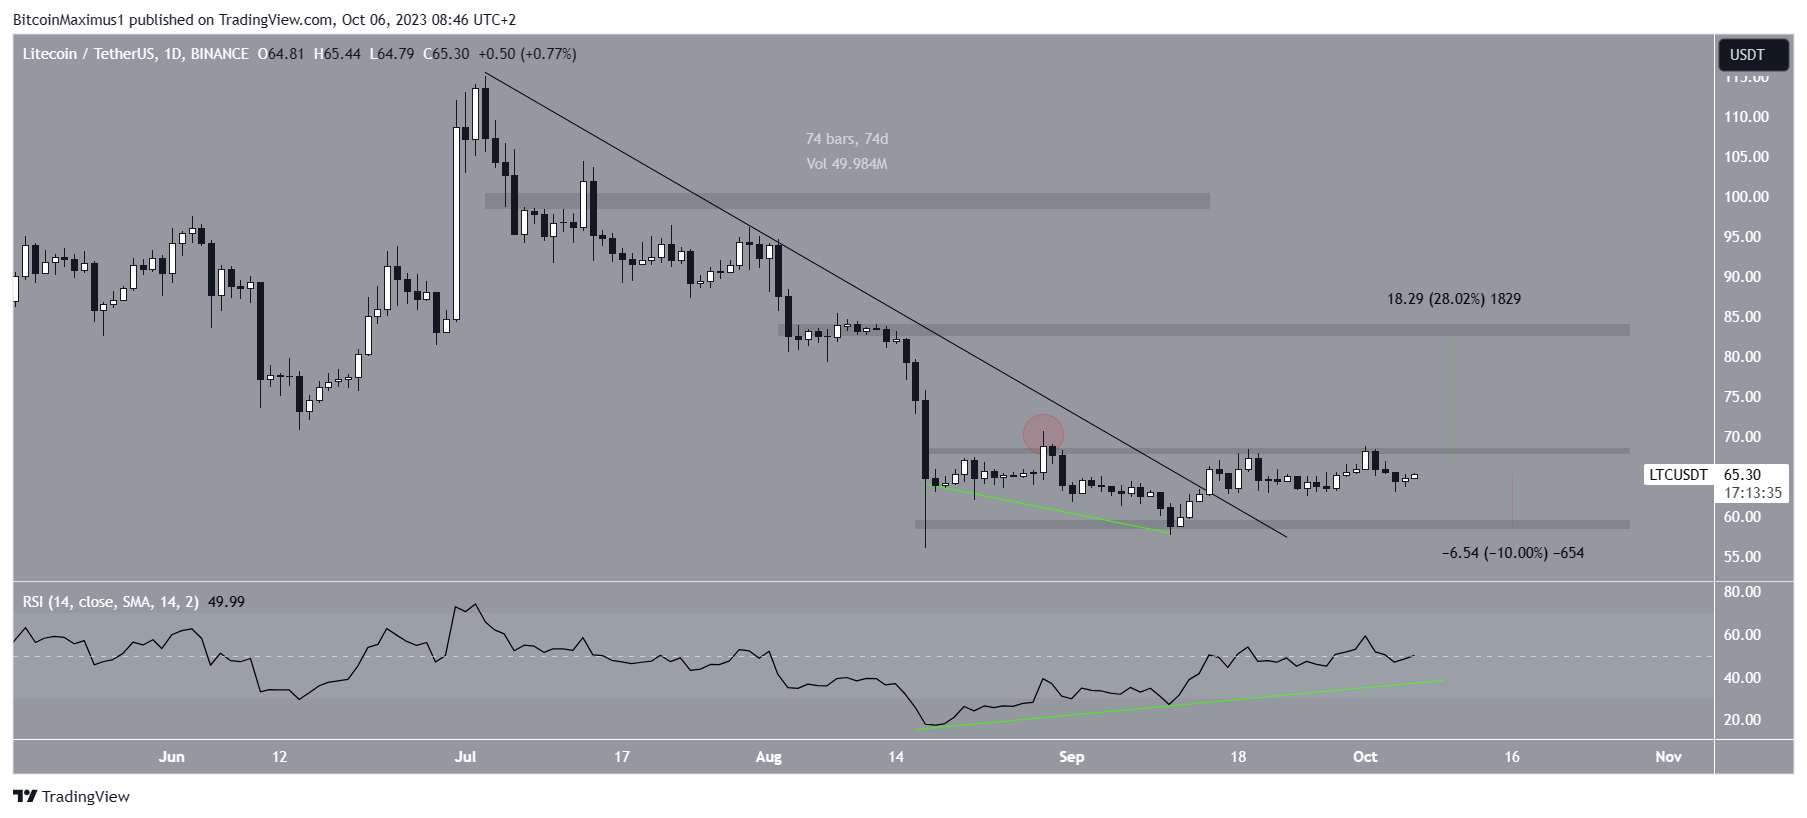
Despite this bullish Litecoin price prediction, failure to break out from the $68 resistance area can result in significant rejection.
A 10% drop to the minor support at $59 will be expected in that case.
For BeInCrypto’s latest crypto market analysis, click here
Disclaimer
In line with the Trust Project guidelines, this price analysis article is for informational purposes only and should not be considered financial or investment advice. BeInCrypto is committed to accurate, unbiased reporting, but market conditions are subject to change without notice. Always conduct your own research and consult with a professional before making any financial decisions.
Leave a Reply