

The LOOM Network (LOOM) price reached a new yearly high of $0.210 today.
LOOM has also reached the $0.200 resistance area, the final one before the all-time high price of $0.770. Will it break into the top 100 cryptocurrencies by market capitalization?
LOOM Reaches New Yearly High
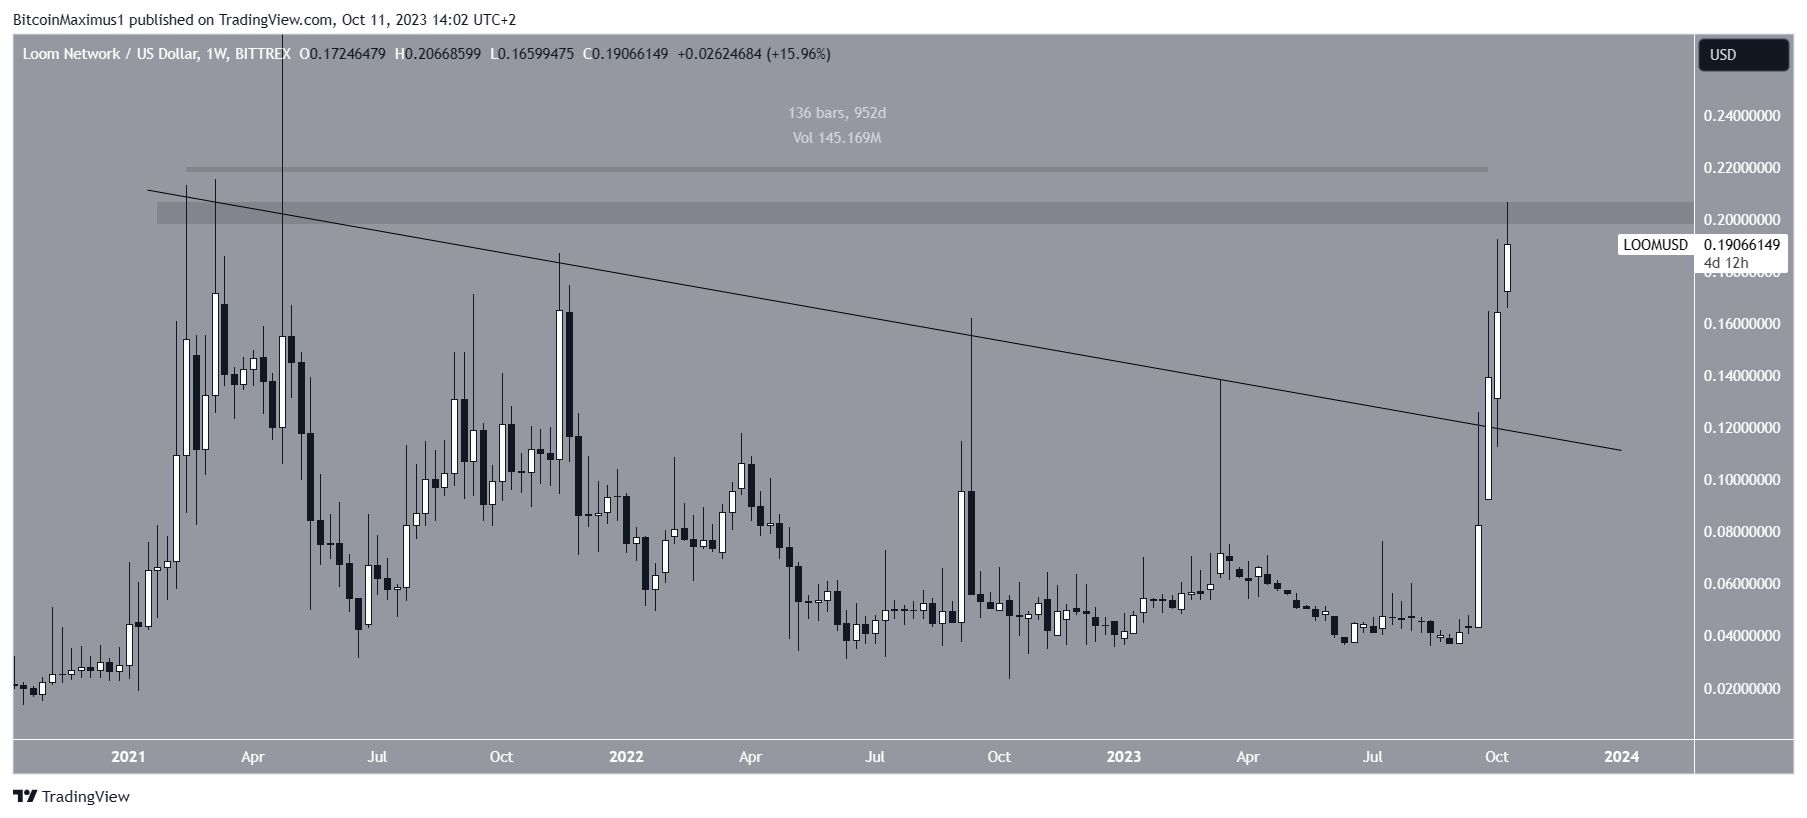
The weekly timeframe technical analysis shows that the LOOM price broke out from a long-term descending resistance trendline at the beginning of October. The trendline had been in place for 950 days.
The movement is not in line with the rest of the crypto market, which has been bearish in October. Before the breakout, the price had made five unsuccessful attempts at doing so.
LOOM has increased rapidly since breaking out and reached a new yearly high of $0.210 today. The altcoin fell slightly afterward, validating the $0.200 horizontal area as resistance.
The resistance area has been in place since 2020 and is the final one before the all-time high of $0.770.
LBANK announced that it will list LOOM on its futures platform on October 11 and will allow users to trade with 10x leverage. Binance Futures made the same announcement today.
It is not certain if the announcements occurred after the massive increase brought the coin to their radar or if the increase occurred due to the anticipation surrounding the futures launch.
LOOM Price Prediction: Will It Crack Top 100 Coins?
Due to the massive price increase, LOOM has nearly entered the top 100 cryptocurrencies by market capitalization. It is currently ranked #107, with a market cap of $26 million, smaller than the #100th ranked cryptocurrency.
Given the circulating supply of 1.2 billion coins, a price of $0.215 will be required for LOOM to enter the top 100 coins.
The weekly RSI supports the ongoing increase. The RSI is a momentum indicator used by traders to evaluate whether a market is overbought or oversold and to determine whether to accumulate or sell an asset.
Readings above 50 and an upward trend suggest that bulls still have an advantage, while readings below 50 indicate the opposite.
The RSI is above 50 and increasing, both signs of a bullish trend.
Even though the indicator is in overbought territory, it has not generated any bearish divergence, which could warn of an impending drop.
If LOOM breaks out above the $0.200 resistance area, the next resistance will be at $0.267, created by the 1.27 external Fib retracement of the most recent drop.
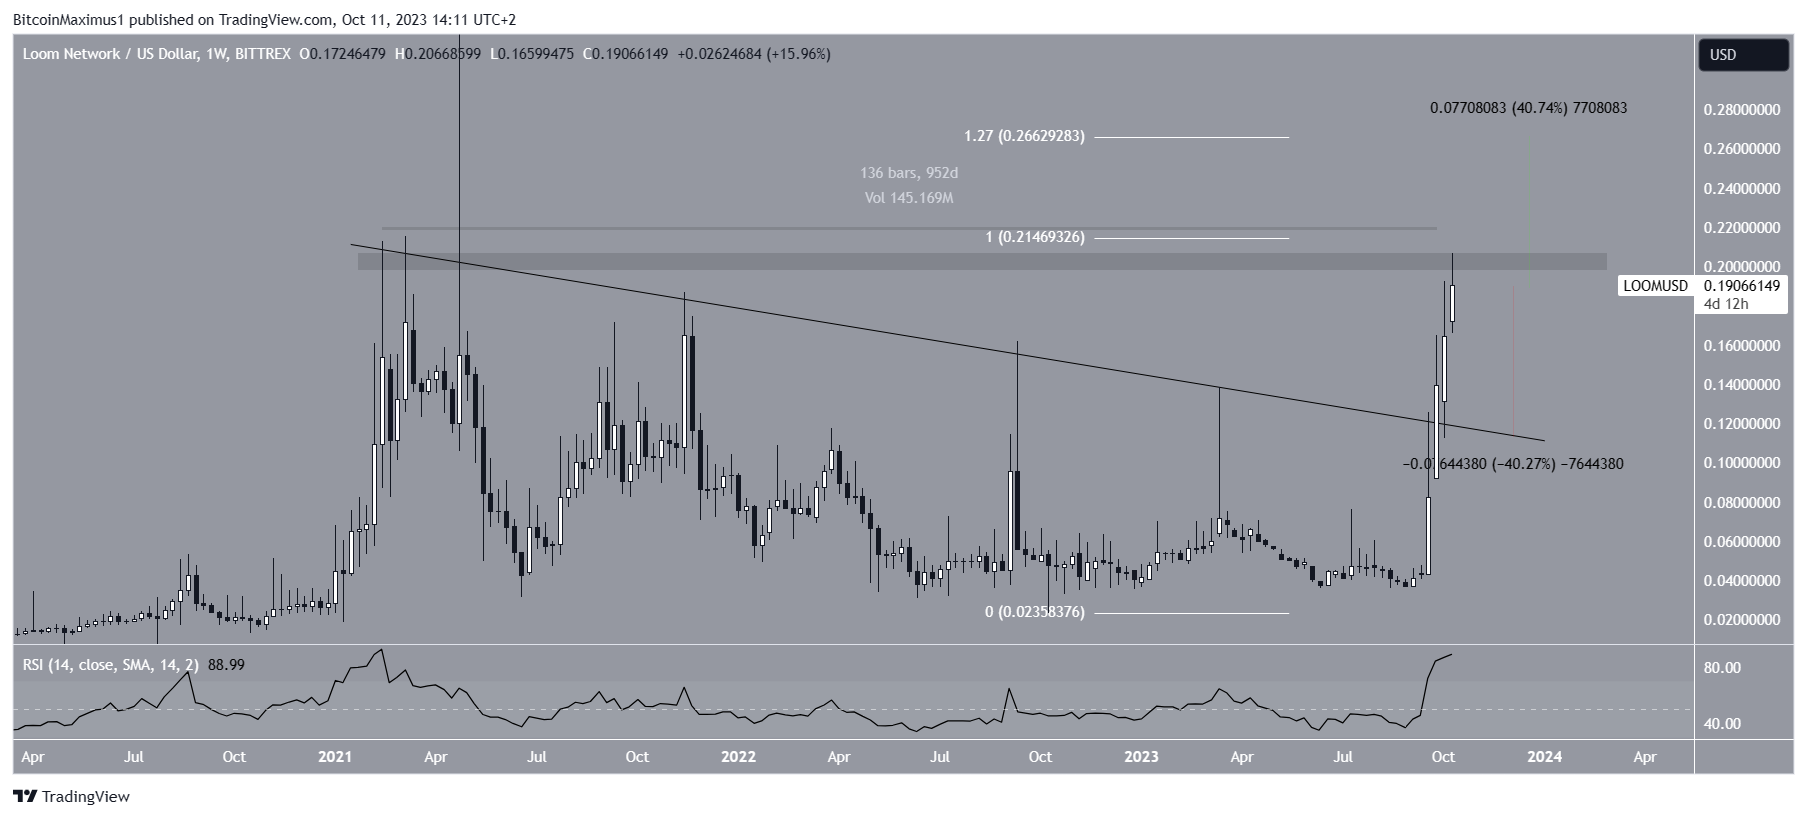
Despite this bullish LOOM price prediction, a sharp rejection from the horizontal area can cause a 40% drop to the long-term descending resistance trendline, currently at $0.120.
For BeInCrypto’s latest crypto market analysis, click here.
Disclaimer
In line with the Trust Project guidelines, this price analysis article is for informational purposes only and should not be considered financial or investment advice. BeInCrypto is committed to accurate, unbiased reporting, but market conditions are subject to change without notice. Always conduct your own research and consult with a professional before making any financial decisions.
Leave a Reply