

The Polygon (MATIC) price created a bearish candlestick last week, validating the $0.60 horizontal area as resistance.
The price also rose from a shorter-term descending resistance trendline on September 29.
MATIC Falls Below Long-Term Resistance
The technical analysis from the weekly timeframe shows that the MATIC price has broken down from the $0.60 horizontal area. The area had previously supported since July 2022 until the cryptocurrency broke down in August 2023.
Two weeks ago, the MATIC price began a significant bounce. However, it was rejected by the $0.60 area last week (red icon), creating a bearish candlestick and confirming the area as resistance. The decrease has been ongoing this week.
Despite this bearish reading, it is worth mentioning that Google Cloud is now an official validator of the Polygon Network after staking more than 10,000 MATIC.
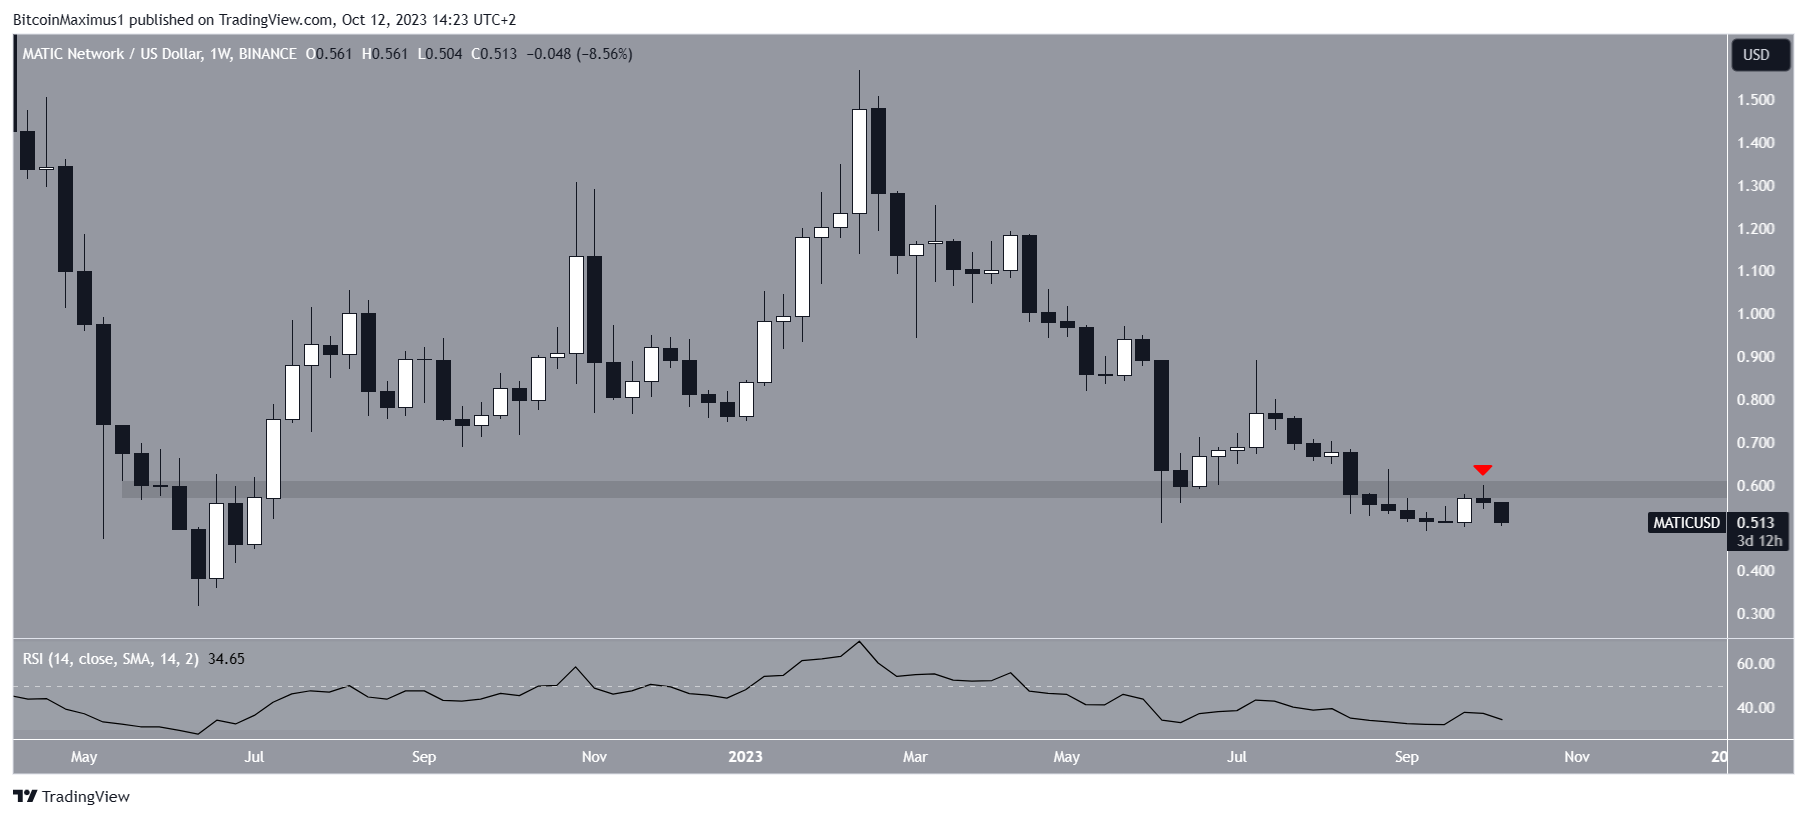
The weekly Relative Strength Index (RSI) is bearish. With the RSI as a momentum indicator, traders can determine whether a market is overbought or oversold and decide whether to accumulate or sell an asset.
If the RSI reading is above 50 and the trend is upward, bulls have an advantage, but if the reading is below 50, the opposite is true.
The indicator is falling and is below 50, both signs of a bearish trend.
MATIC Price Prediction: Can Breakout be Sustained?
While the weekly timeframe outlook is bearish, the technical analysis from the daily timeframe is not as clear.
On the bullish side, MATIC has broken out from a descending resistance trendline, which has been in place since February. This is a sign that the previous movement is complete and a new one has begun in the other direction.
The altcoin‘s breakout preceded a bullish divergence in the RSI (green line). This bullish development is created when a momentum increase accompanies a price decrease. It often leads to significant breakouts, as was the case in MATIC.
However, the MATIC price could not sustain its increase after breaking out. Rather, MATIC fell close to its pre-breakout levels.
If the decrease continues, the cryptocurrency could validate the descending resistance trendline as support. The trendline is currently at $0.45, 10% below the current price.
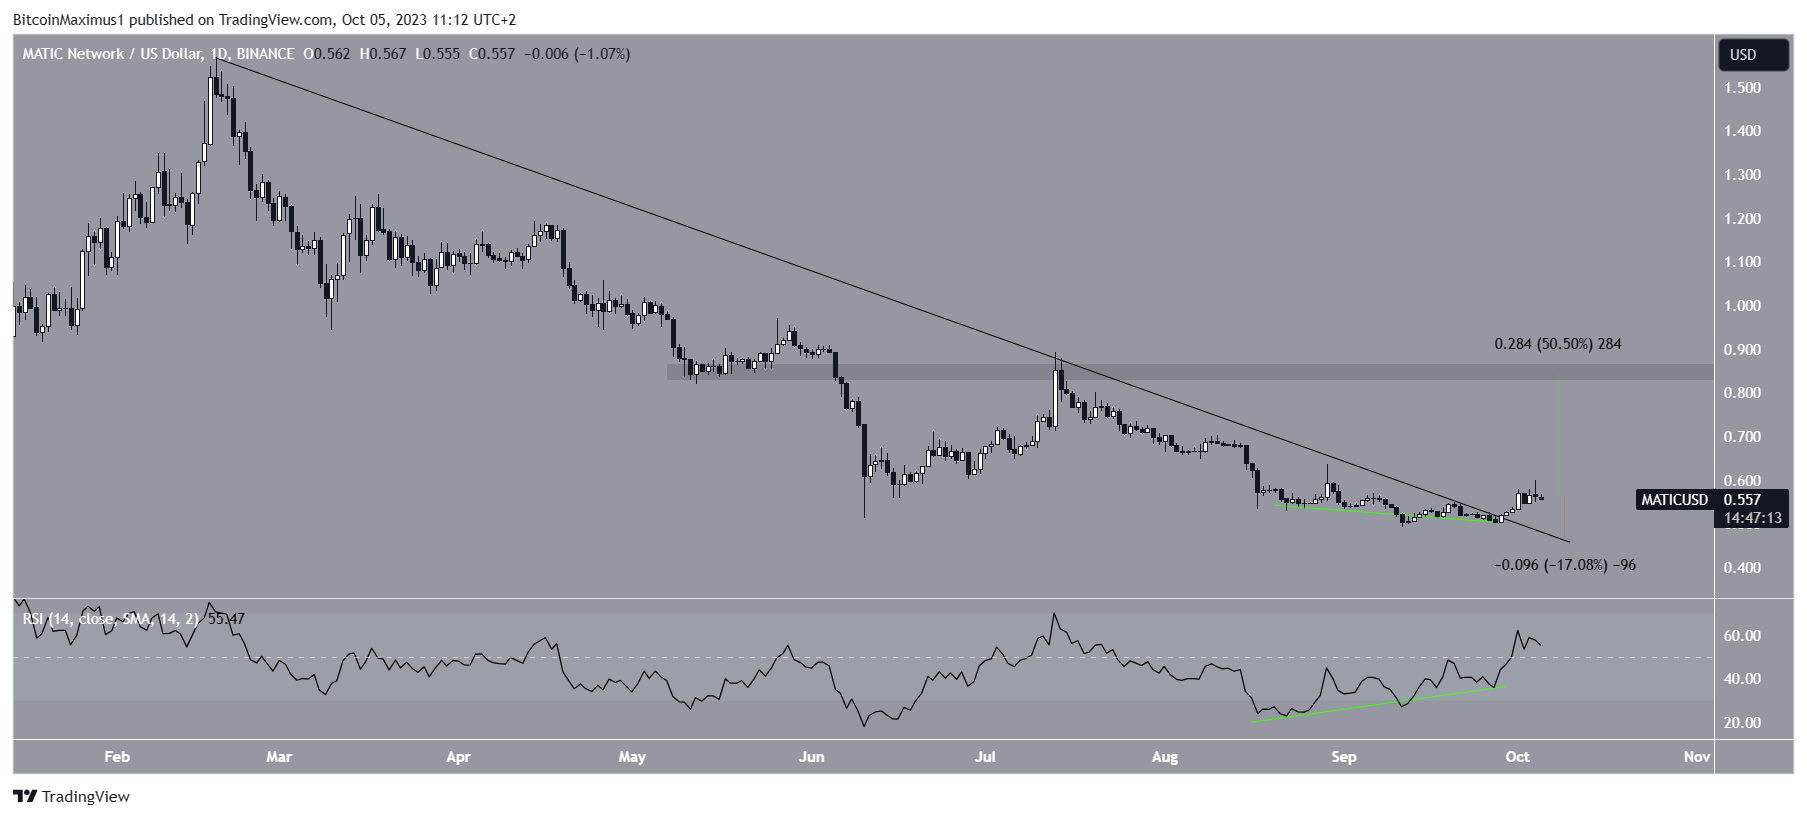
Despite this bearish MATIC price prediction, a weekly close above the $0.60 horizontal resistance area can lead to an increase towards $0.85.
This will be an upward movement of 67% measuring from the current price.
For BeInCrypto’s latest crypto market analysis, click here.
Disclaimer
In line with the Trust Project guidelines, this price analysis article is for informational purposes only and should not be considered financial or investment advice. BeInCrypto is committed to accurate, unbiased reporting, but market conditions are subject to change without notice. Always conduct your own research and consult with a professional before making any financial decisions.
Leave a Reply