

The STORJ price broke out from the $0.50 horizontal resistance area this week. It reached a high of $0.64, the highest in 440 days.
The price has yet to reach a weekly close above this area, something that would confirm the breakout. But will it do so?
STORJ Breaks out From Long-Term Resistance
The STORJ price has traded in a range between $0.25 and $0.50 since the start of the year. During this time, both the resistance and support areas have been validated numerous times (red and green icons).
More recently, STORJ bounced at the range low in August, creating a very long lower wick, considered a sign of buying pressure. This catalyzed the ongoing upward movement.
After another failed attempt at breaking out in October (black icon), the STORJ price finally broke out this week, reaching a high of $0.64. This is the highest price in 440 days.
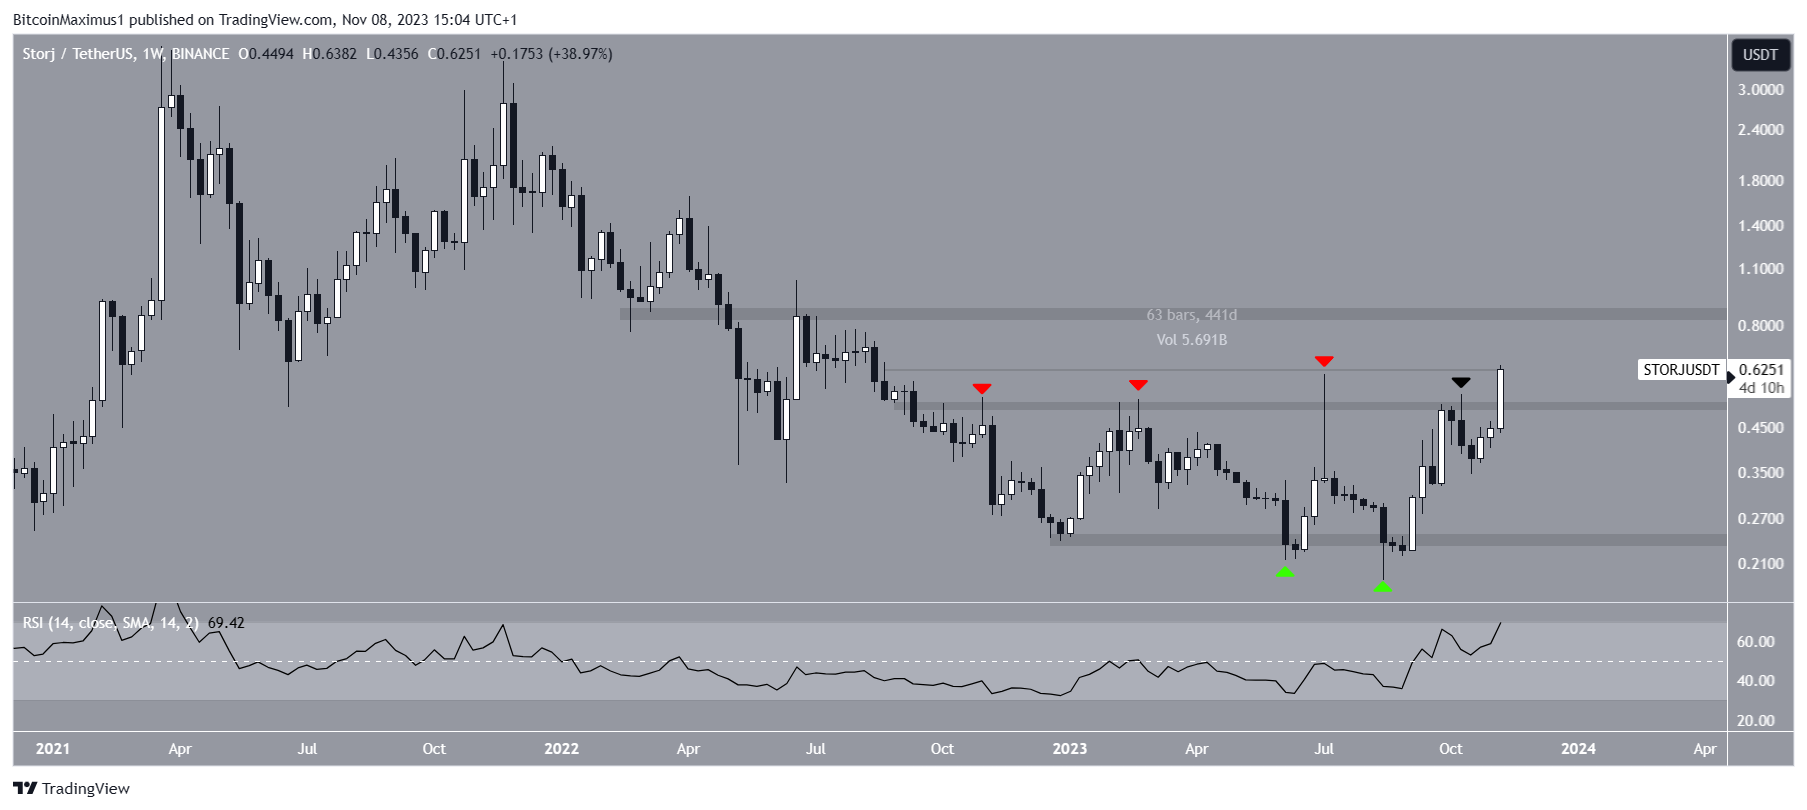
The Relative Strength Index (RSI) is a momentum indicator traders use to evaluate whether a market is overbought or oversold and whether to accumulate or sell an asset. Readings above 50 and an upward trend suggest that bulls still have an advantage, while readings below 50 indicate the opposite.
The weekly RSI is increasing and is above 50, both considered positive signs. Furthermore, the indicator generated bullish divergence during the August low (green line). A bullish divergence occurs when a momentum increase accompanies a price decrease.
Read More: 9 Best AI Crypto Trading Bots to Maximize Your Profits
STORJ Price Prediction: Is $1 Achievable?
Technical analysts employ the Elliott Wave theory as a means to identify recurring long-term price patterns and investor psychology, which helps them determine the direction of a trend.
The daily timeframe Elliott Wave count is bullish. It indicates that STORJ is in wave three of a five-wave upward movement.
The daily RSI supports this bullish outlook for the altcoin. The indicator is above 50 and increasing, both signs of a bullish trend. Furthermore, the RSI broke out from its bearish divergence trendline (green line), a sign that the correction is complete.
Read More: 9 Best Crypto Demo Accounts For Trading
Cryptocurrency trader on X (formerly Twitter) are decisively bullish.
Chill_Trader99 believes that a short-squeeze is currently underway, while Binance_Master suggests that the STORJ price will reach $0.90.
If wave one and three have the same length, STORJ will reach a high of $0.70, 12% above the current price. If wave three extends and has 1.61 times the length of wave one, the price can increase by 45% and reach the next resistance at $0.91.
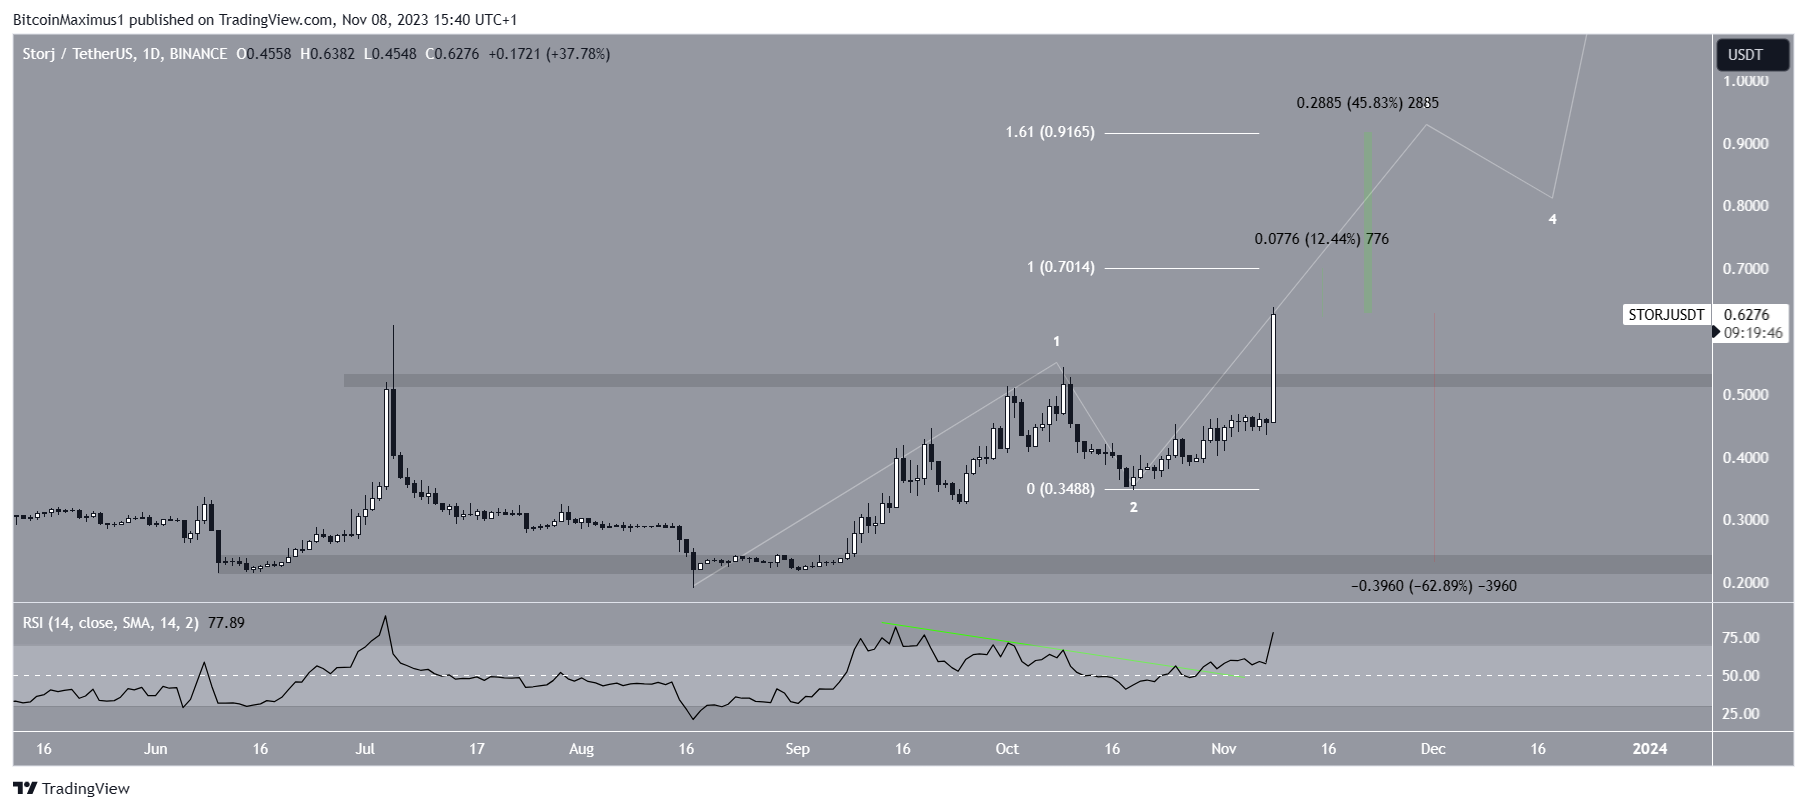
Despite this bullish STORJ price prediction, a close below the $0.50 horizontal area will invalidate the breakout. In that case, STORJ can fall by 60% to the long-term support at $0.24.
For BeInCrypto’s latest crypto market analysis, click here.
Disclaimer
In line with the Trust Project guidelines, this price analysis article is for informational purposes only and should not be considered financial or investment advice. BeInCrypto is committed to accurate, unbiased reporting, but market conditions are subject to change without notice. Always conduct your own research and consult with a professional before making any financial decisions.
Leave a Reply