

The Shiba Inu (SHIB) price broke down from a short-term support but still holds above a long-term one.
Will it be enough to initiate a trend reversal, or will SHIB decrease below the long-term support?
Can Shiba Find Support?
The technical analysis of the weekly time frame shows that SHIB could not sustain its November 2023 breakout. At the time, the Shiba Inu price had broken out from a descending resistance trend line that had existed for nearly 500 days.
The upward movement led to a high of $0.000012 (red icon) before the price started falling.
Since then, the SHIB price has validated the resistance trend line twice (green icons) but failed to initiate any sort of bounce despite trading above the trend line.
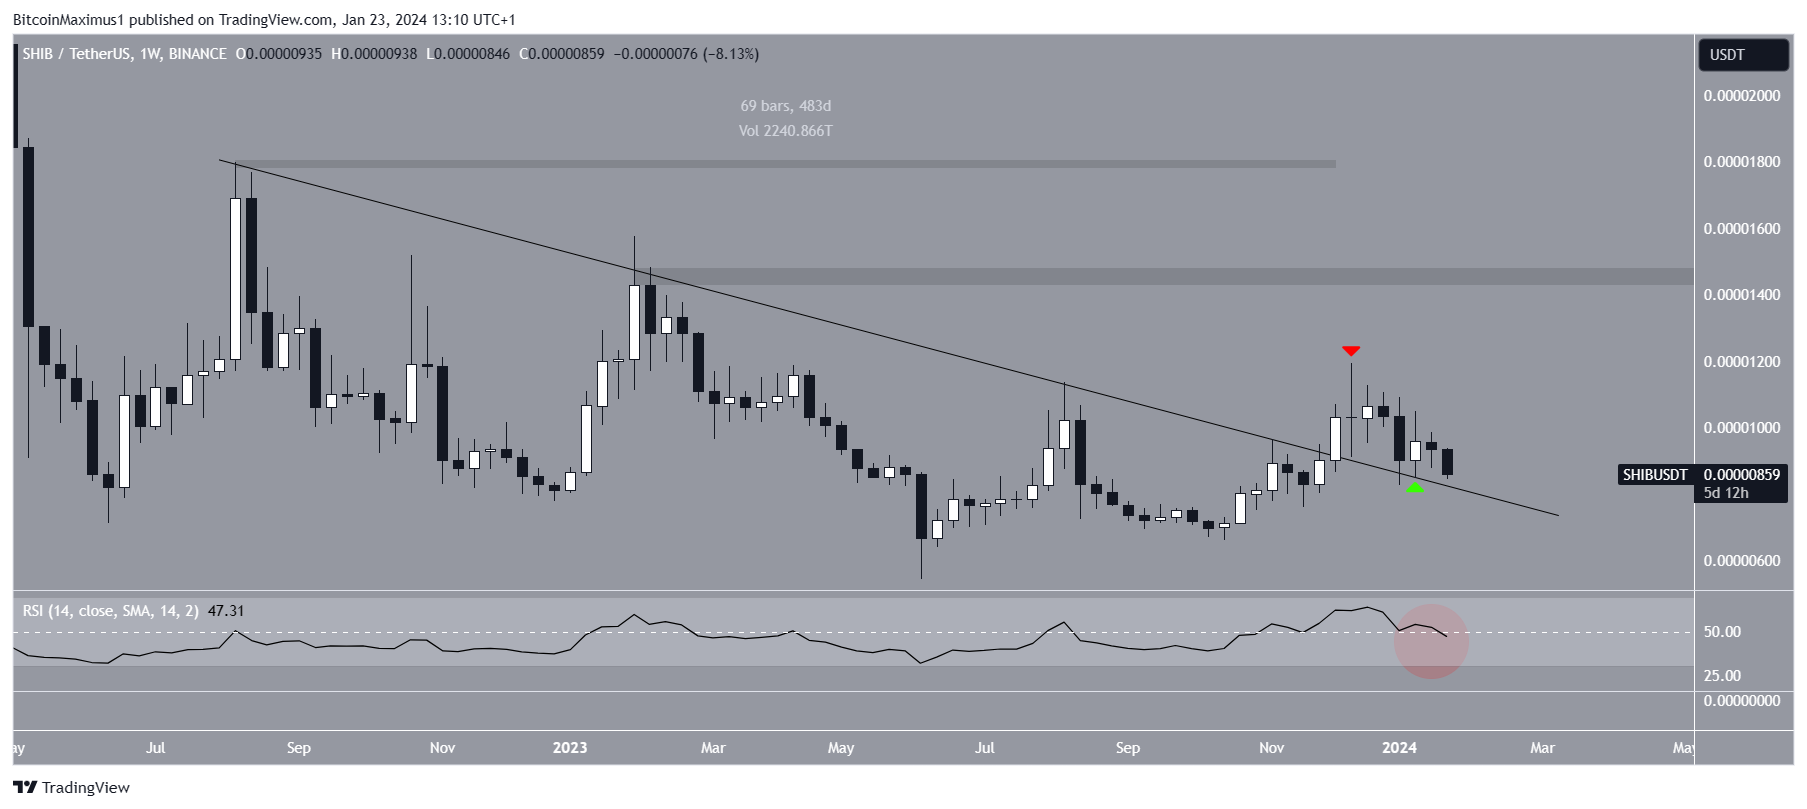
The weekly RSI is leaning bearish, though it has not confirmed this yet. Traders utilize the RSI as a momentum indicator to assess whether a market is overbought or oversold and whether to accumulate or sell an asset.
If the RSI reading is above 50 and the trend is upward, bulls still have an advantage, but if the reading is below 50, the opposite is true. The indicator is falling but trades at 50 (red circle).
Read More: How To Buy Shiba Inu (SHIB) and Everything You Need To Know
SHIB Price Prediction: How Long Will Decrease Continue?
The technical analysis of the daily time frame aligns with the weekly one. It shows that the SHIB price has traded inside an ascending parallel channel since June 2023. The upward movement led to a high of $0.0000120 in December (red icon).
However, SHIB has fallen since the rejection. After briefly trading above the $0.0000092 area, SHIB broke down from it yesterday.
The daily RSI, which is below 50 and falling, supports the bearish price action. If the downward movement continues, SHIB can fall 12% to the channel’s support trend line at $0.00000800.
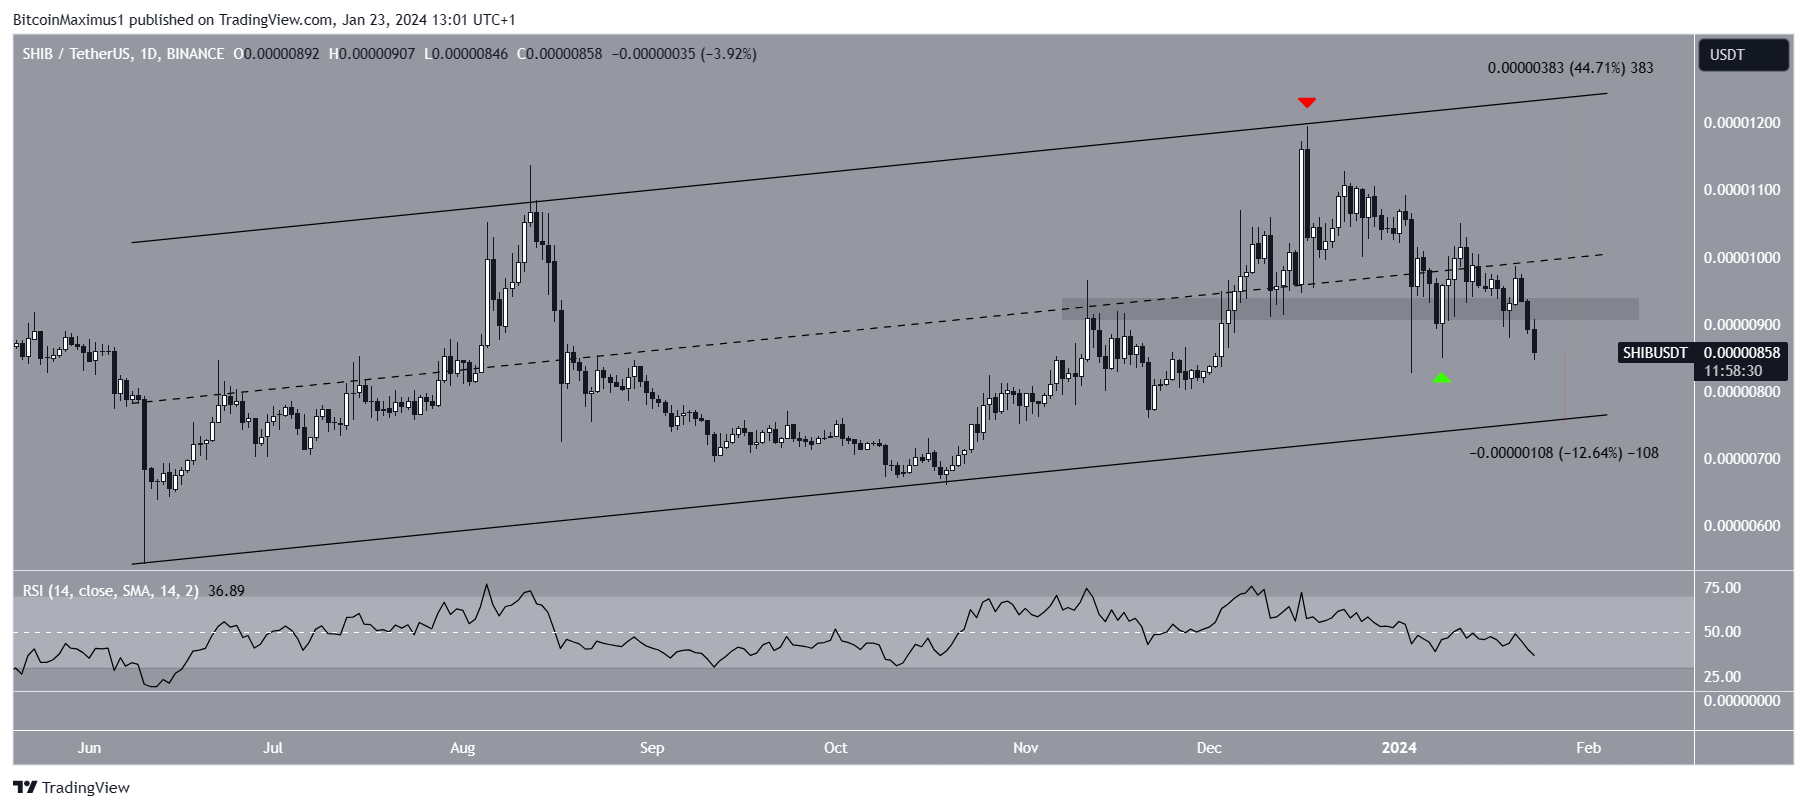
Despite the bearish SHIB price prediction, reclaiming the $0.0000092 area can trigger a 45% increase to the channel’s resistance trend line at $0.0000124.
Read More: Shiba Inu Burn Rate Explained: Understanding Token Burning
For BeInCrypto’s latest crypto market analysis, click here.
Disclaimer
In line with the Trust Project guidelines, this price analysis article is for informational purposes only and should not be considered financial or investment advice. BeInCrypto is committed to accurate, unbiased reporting, but market conditions are subject to change without notice. Always conduct your own research and consult with a professional before making any financial decisions. Please note that our Terms and Conditions, Privacy Policy, and Disclaimers have been updated.
Leave a Reply