

The XRP price has fallen since July 2023, creating a lower high in November.
XRP trades at a confluence of long- and short-term support levels. Will it break down or bounce?
Ripple Price at Risk of Long-Term Breakdown?
The weekly time frame technical analysis shows that XRP has increased alongside an ascending support trend line since November 2022. The trend line has been validated eight times (green icons) so far.
However, depending on the weekly close, the XRP price risks breaking down from the trend line. So far, the trend line has existed for nearly 450 days.
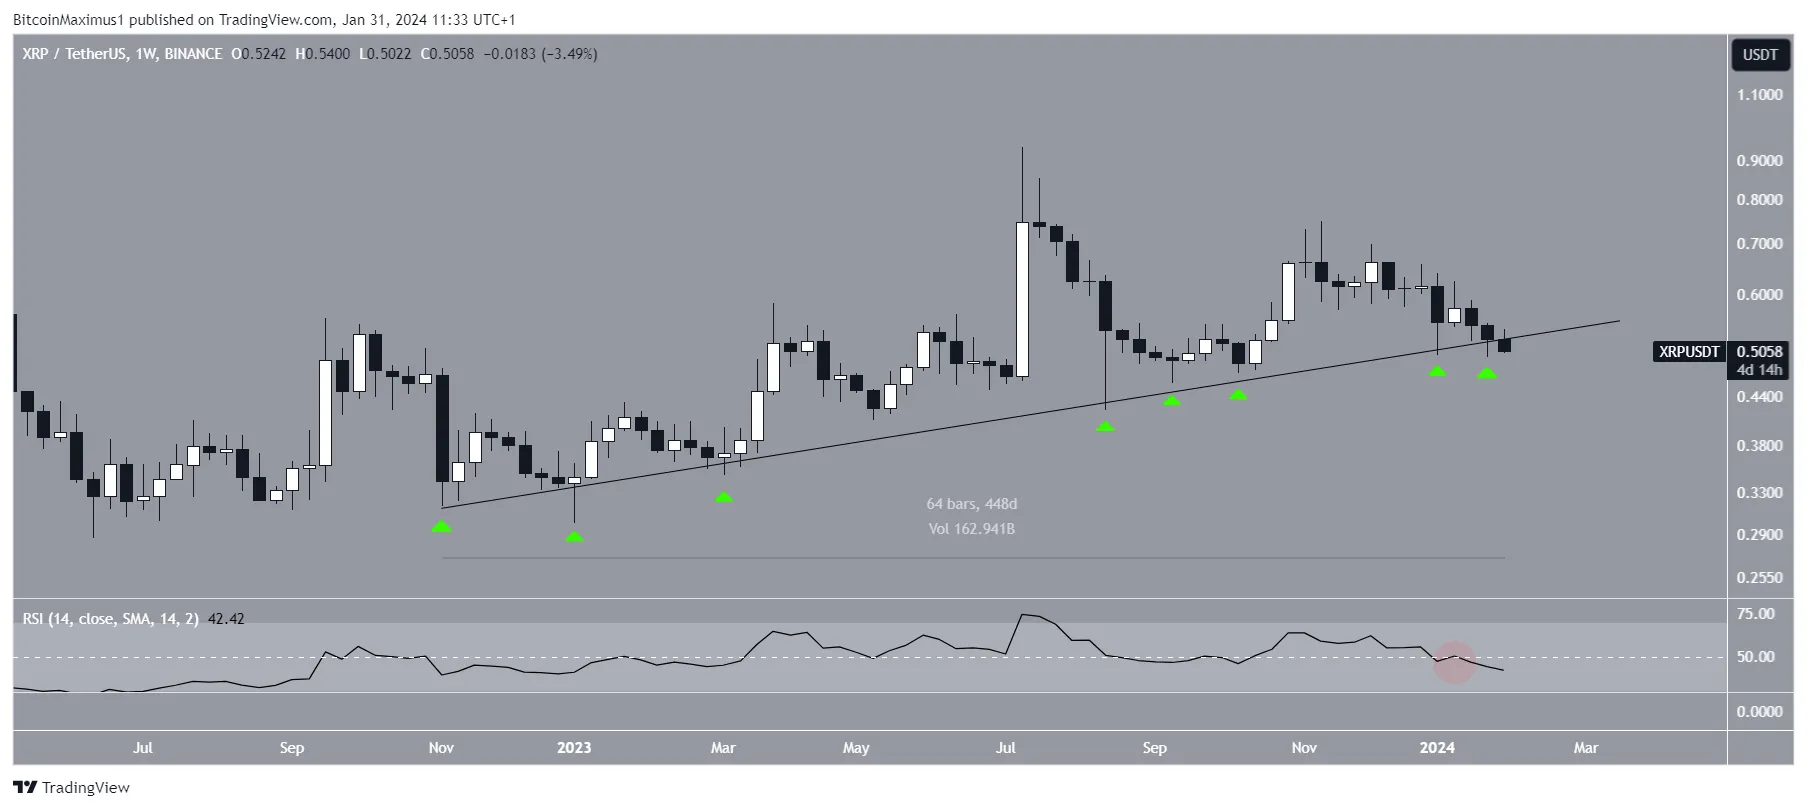
The weekly Relative Strength Index (RSI) supports the breakdown. When evaluating market conditions, traders use the RSI as a momentum indicator to determine whether a market is overbought or oversold and whether to accumulate or sell an asset.
If the RSI reading is above 50 and the trend is upward, bulls still have an advantage, but if the reading is below 50, the opposite is true. The indicator is below 50 and falling (red circle), considered a sign of a bearish trend.
Read More: How To Buy XRP and Everything You Need To Know
Analysts Weigh in on Price Action
Cryptocurrency traders and analysts on X worry about the future XRP trend due to its failure to bounce. Maximus Prime noted the XRP price is barely holding on to a long-term confluence of support levels.
Anders is frustrated about the lack of a proper bounce, while 360Trader had a message about long-term XRP holders:
if your crypto life revolves around $XRP I feel sorry for you. There has been money flying around all over the place. Being a one trick pony in crypto – IS DOING IT WRONG. no matter what the weird cult take over the world meme influencer told you.
Read More: How to Sell Ripple
XRP Price Prediction: Is a Breakdown on the Cards?
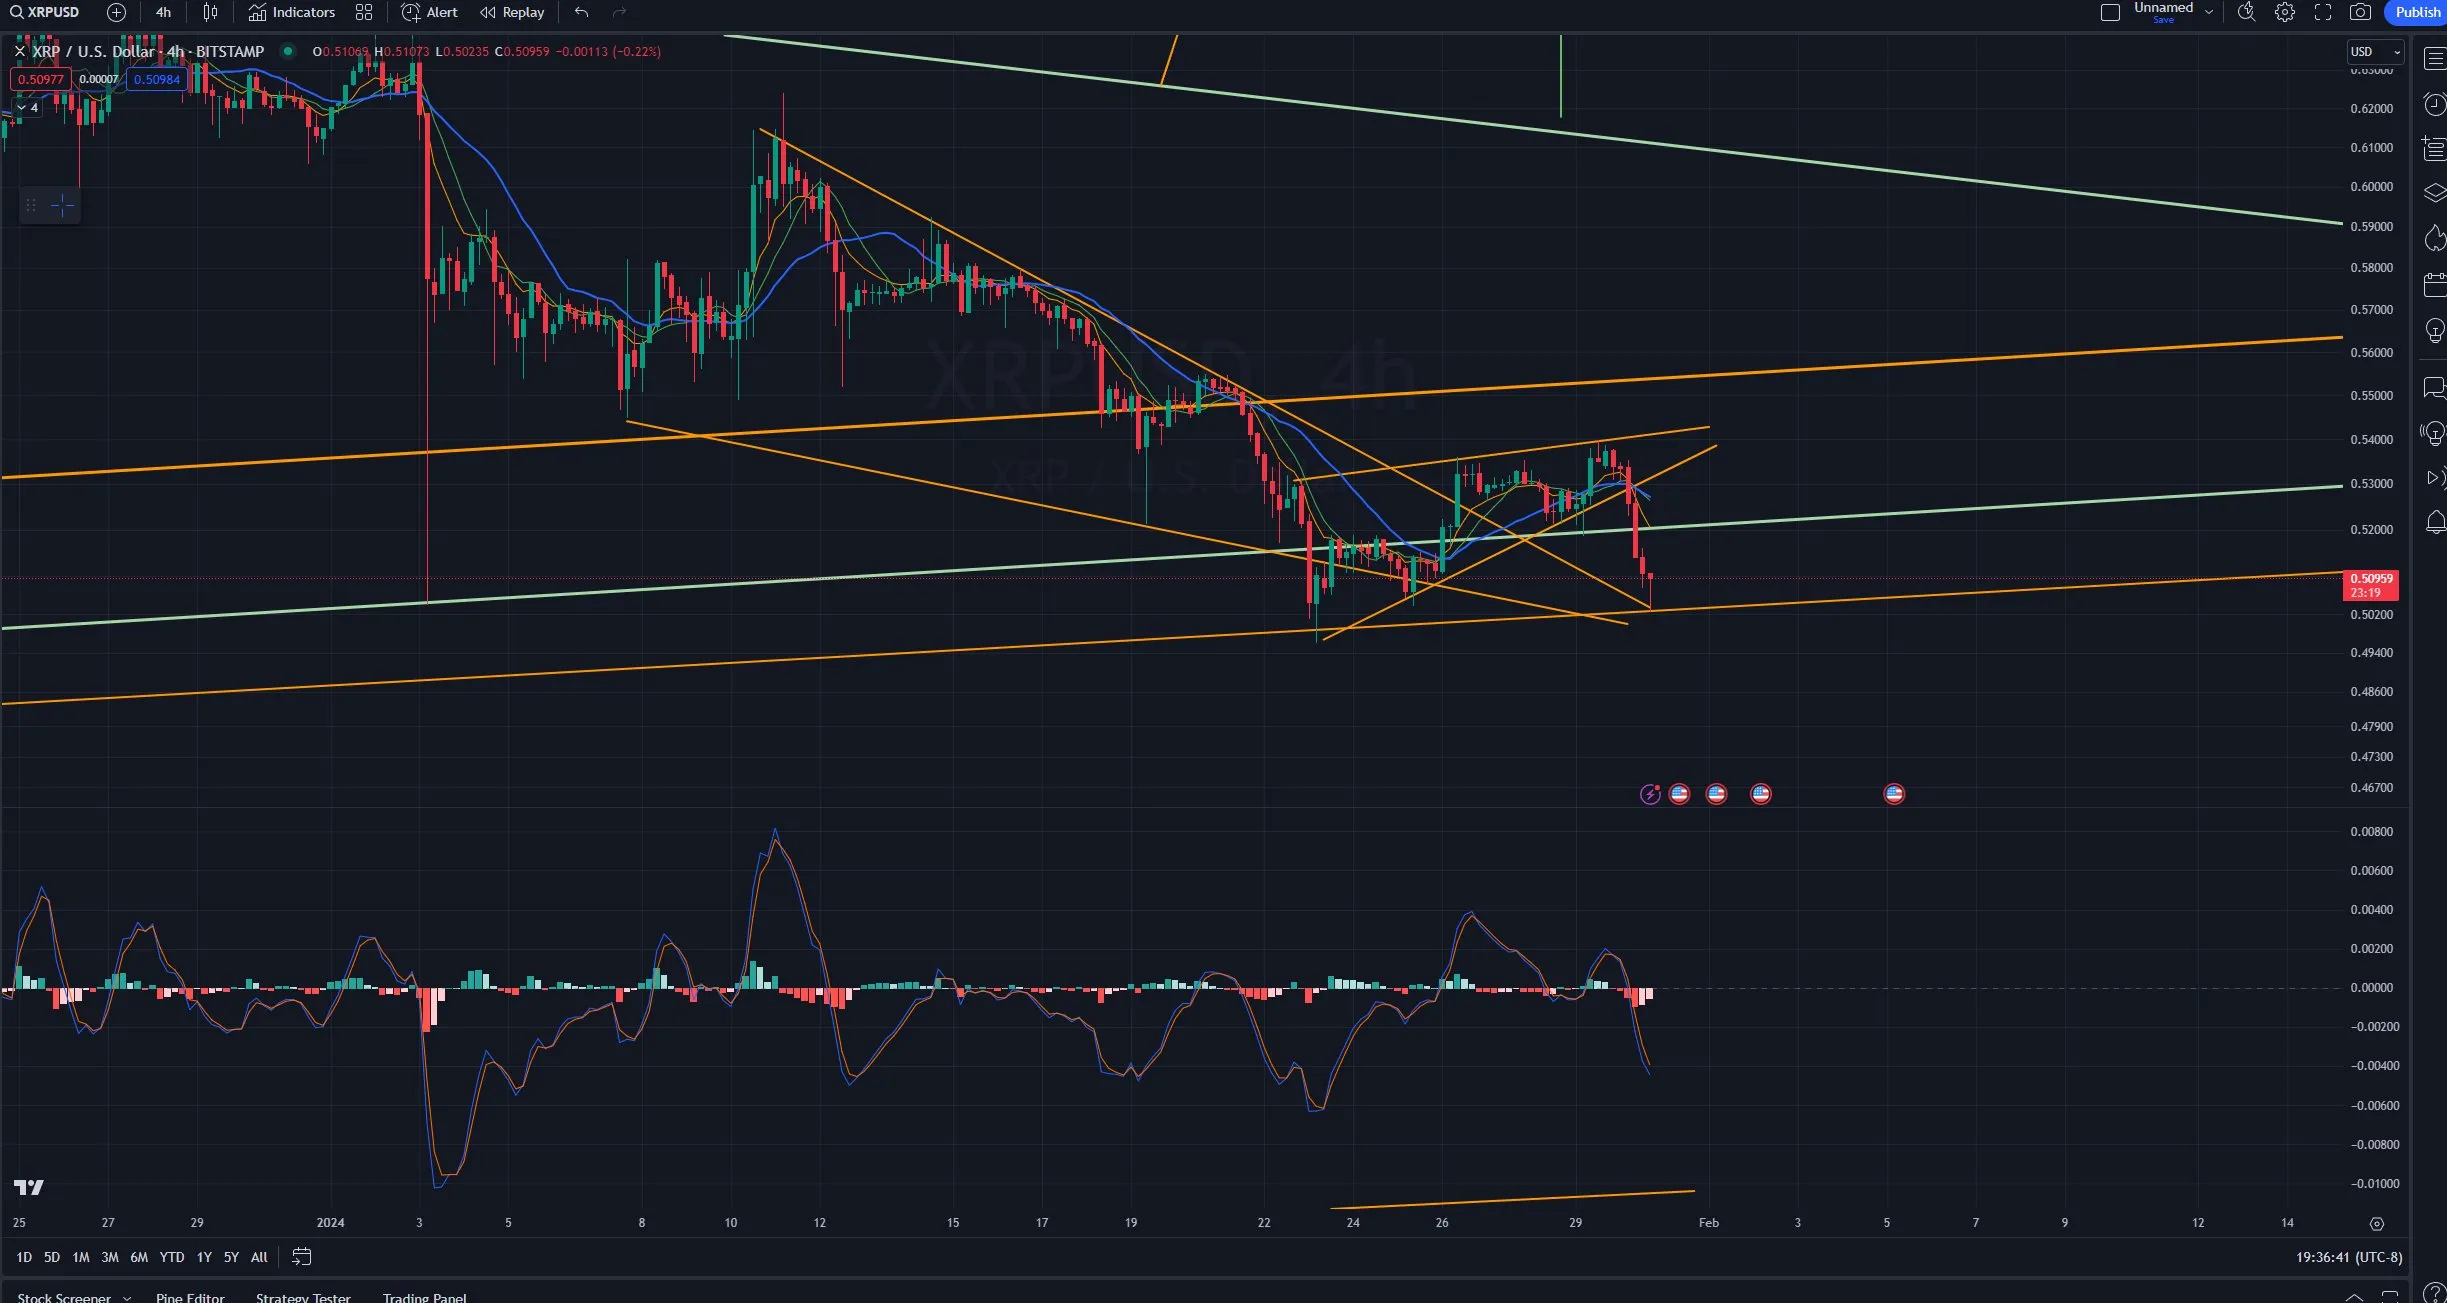
The technical analysis of the daily time frame gives a similarly bearish outlook because of the price action and RSI.
The XRP price is breaking down from a descending parallel channel that has existed for 86 days. It currently trades very close to its support trend line. During this time, XRP broke down from the $0.55 horizontal area.
The daily RSI is below 50 and falling, both signs of a bearish trend. If XRP breaks down from the channel, it can fall 12% to the closest support area at $0.45.

Despite this bearish XRP price prediction, an increase above $0.55 can trigger a 24% upward movement to the channel’s resistance trend line at $0.62.
For BeInCrypto‘s latest crypto market analysis, click here.
Disclaimer
In line with the Trust Project guidelines, this price analysis article is for informational purposes only and should not be considered financial or investment advice. BeInCrypto is committed to accurate, unbiased reporting, but market conditions are subject to change without notice. Always conduct your own research and consult with a professional before making any financial decisions. Please note that our Terms and Conditions, Privacy Policy, and Disclaimers have been updated.
Leave a Reply