

The Solana (SOL) price has increased in the past two weeks but failed to move above the pivotal $100 resistance area.
Will SOL increase to new highs in February, or will the price suffer a correction? Let’s find out.
Solana Breaks Out From Channel
The technical analysis of the daily time frame shows that SOL has fallen inside a descending parallel channel since December 25, 2023. The downward movement led to a low of $79 on January 23, 2024.
The Solana price has increased since and broke out from the channel five days later. Despite the breakout, SOL failed to clear the main horizontal resistance area. Rather, it was rejected and is returning to the channel’s resistance trend line.
It is also worth noting that the Solana team will hold a panel chat today to discuss token extensions in an online panel.
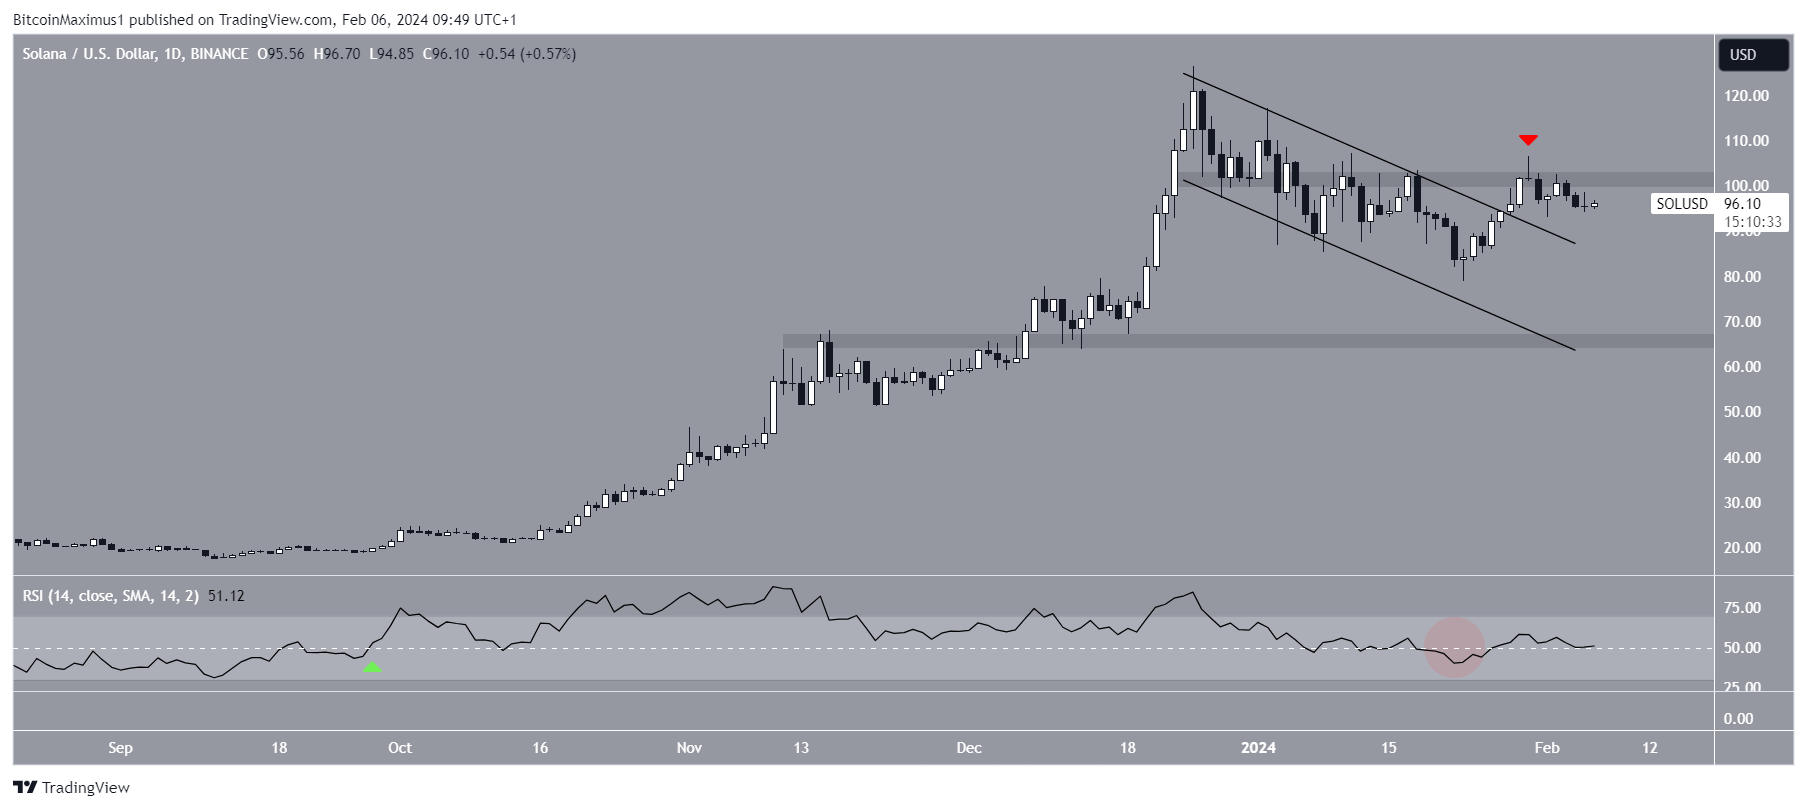
The daily Relative Strength Index (RSI) shows compelling readings. The RSI is a momentum indicator traders use to evaluate whether a market is overbought or oversold and whether to accumulate or sell an asset.
Readings above 50 and an upward trend suggest that bulls still have an advantage, while readings below 50 indicate the opposite.
The RSI moved above 50 (red icon) in October 2023, when the upward movement had just started. Then, it fell below 50 (red circle) in January 2024 but has moved above the level again. Whether it maintains this increase or falls below 50 again can be key for the future trend.
Read More: How to Buy Solana (SOL) and Everything You Need to Know
SOL Price Prediction: Will February be Bullish?
The Elliott Wave count from the daily time frame does not confirm the trend’s direction either.
Technical analysts employ the Elliott Wave theory to identify recurring long-term price patterns and investor psychology, which helps them determine the direction of a trend.
The most likely wave count suggests wave three ended with the December 2023 high mentioned above. However, whether wave four has ended or is still in progress is uncertain.
Read More: Top 6 Solana Projects With Massive Potential
While the SOL price reached the 0.382 Fib retracement support level, it was very short in time compared to wave three.
Cryptocurrency trader Altcoin Sherpa is also uncertain about the future trend. He tweeted:
I am not actively trading this bag and think that it’ll be a big winner in 2024. That said, I’ve got all sorts of conflicting thoughts on where this goes in the midterm. I thought the double top idea at $120 was one. But if it doesn’t hold above $100, I think we see $70.
As outlined before, the Solana price reaction to the $100 area and the RSI movement above or below 50 can determine the future trend’s direction.
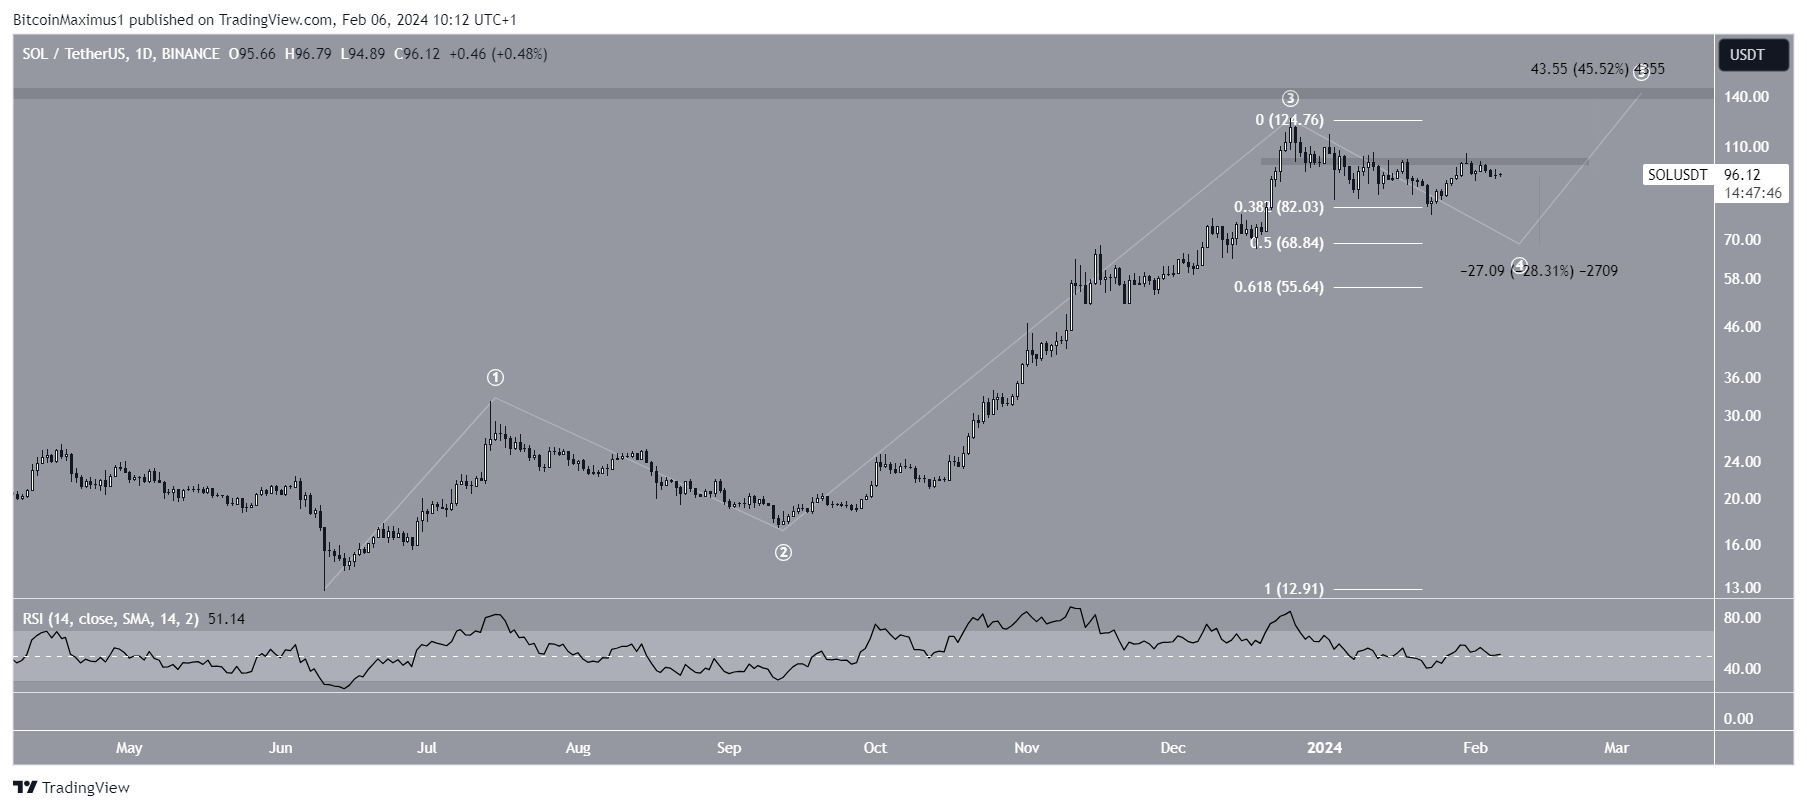
If wave four is not done, the SOL price can fall another 30% to the 0.5 Fib retracement support level at $69. Conversely, if wave five has started, SOL will be expected to increase 45% to the next resistance at $140.
For BeInCrypto‘s latest crypto market analysis, click here
Disclaimer
In line with the Trust Project guidelines, this price analysis article is for informational purposes only and should not be considered financial or investment advice. BeInCrypto is committed to accurate, unbiased reporting, but market conditions are subject to change without notice. Always conduct your own research and consult with a professional before making any financial decisions. Please note that our Terms and Conditions, Privacy Policy, and Disclaimers have been updated.
Leave a Reply