

Curve DAO Token (CRV) price has likely completed its correction and will confirm this with a breakout from the current wedge pattern.
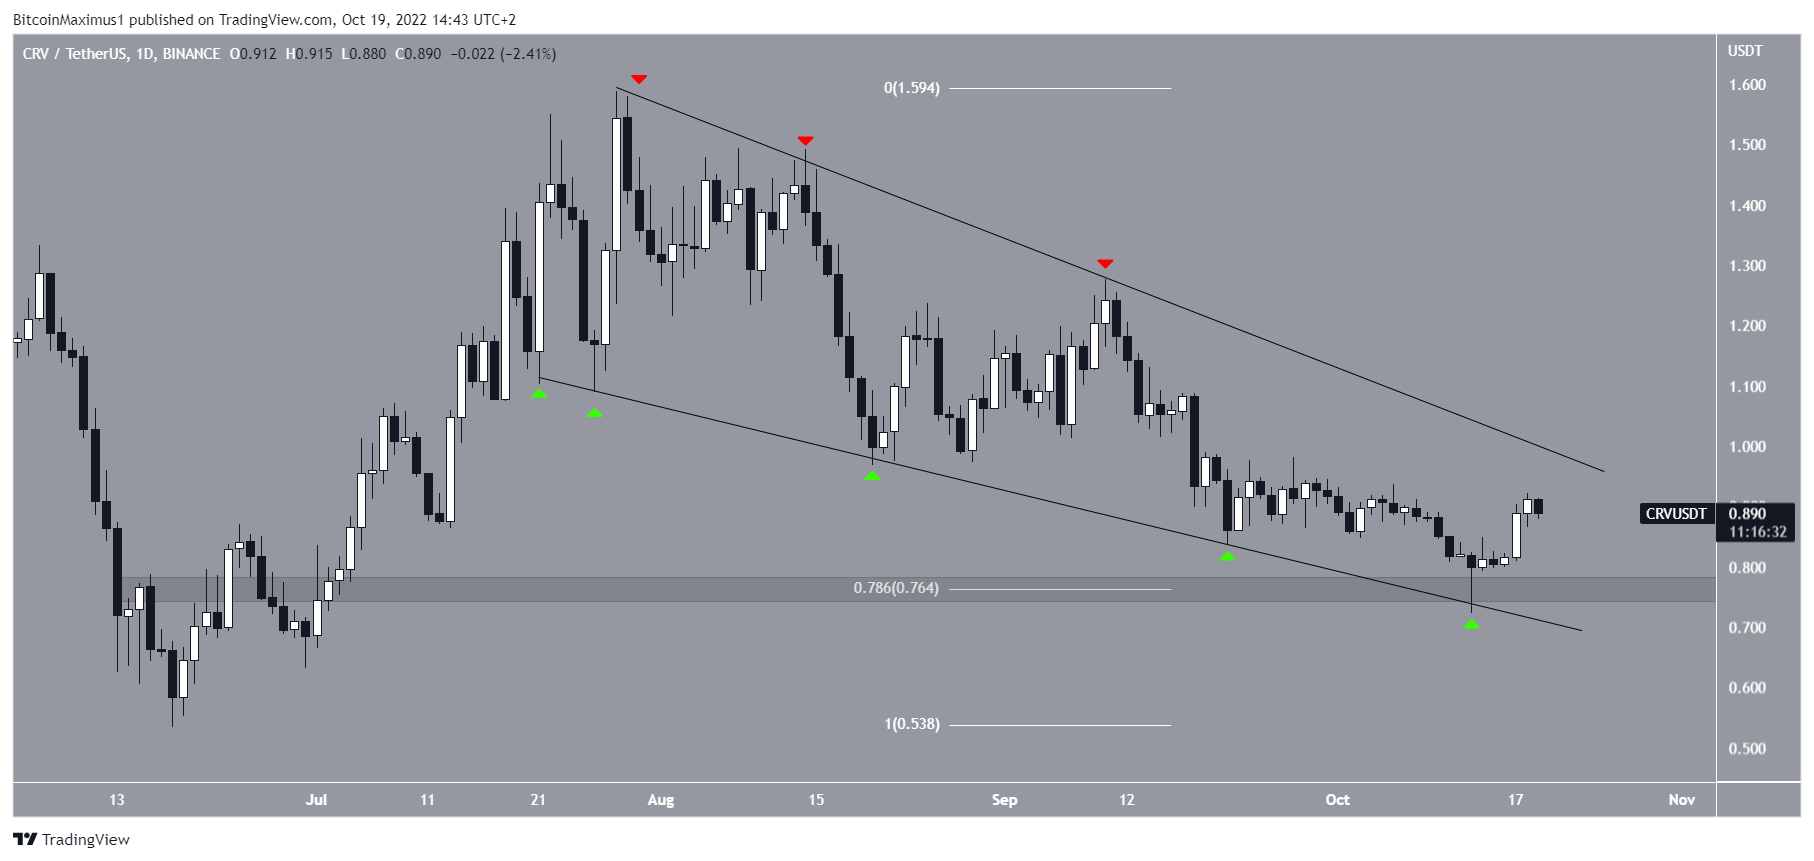
CRV has been decreasing since July 28. The price action is contained inside a descending wedge. The descending wedge is considered a bullish pattern, meaning that an eventual breakout from it would be the most likely scenario.
Both the resistance (red icons) and support lines (green icons) of the wedge have been validated sufficient times, confirming their slopes and legitimacy.
On Oct. 13, the CRV price fell to a minimum price of $0.72. Shortly afterward, it bounced sharply and created a long lower wick. The wick served to validate both the $0.76 horizontal and Fib support area and the support line of the wedge.
As a result of this increase, an eventual breakout from the wedge is expected.
CRV price wave count supports breakout
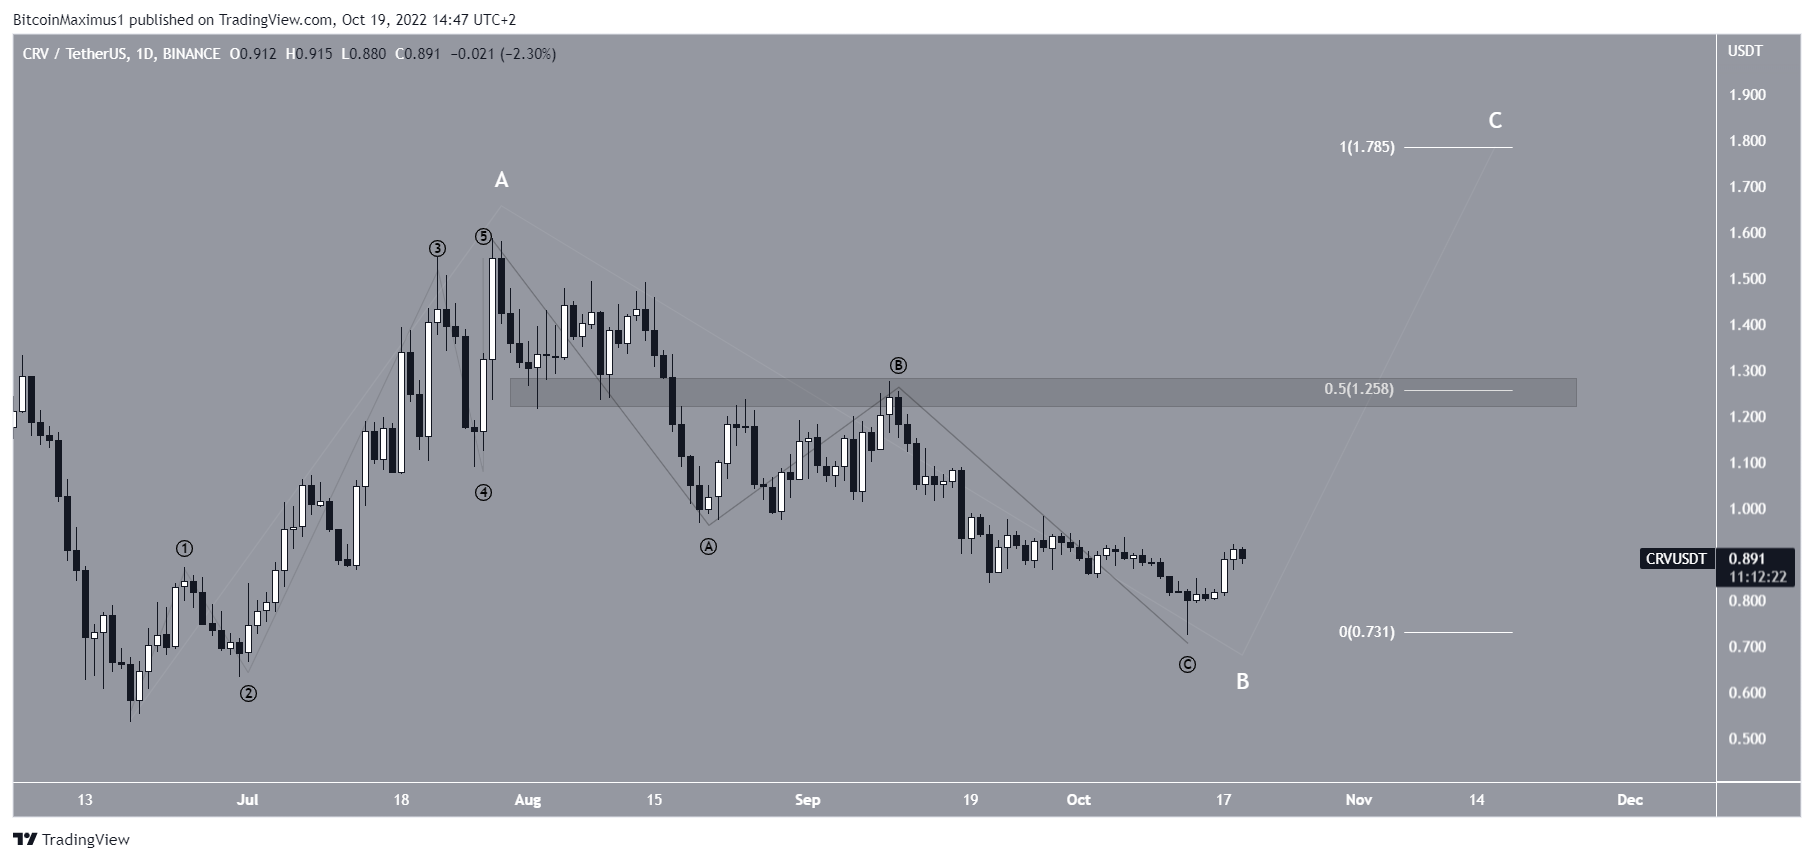
The wave count is also in alignment with the readings from the daily timeframe. After completing a five-wave upward movement (black), the CRV price seems to have completed an A-B-C corrective structure, that ended with the aforementioned $0.72 low.
If the count is correct, it would mean that CRV will now begin another upward movement. While it is not yet clear if this move is an A-B-C structure (white) or a new impulse, an increase toward $1.78 would be expected either way. This would give waves A:C a 1:1 ratio.
However, prior to getting there, there is short-term Fib and horizontal resistance at $1.26.
A fall below the Oct. 13 low of $0.72 would invalidate this wave count and indicate that new lows are in store.
Curve DAO Token Long-term trend is still undetermined
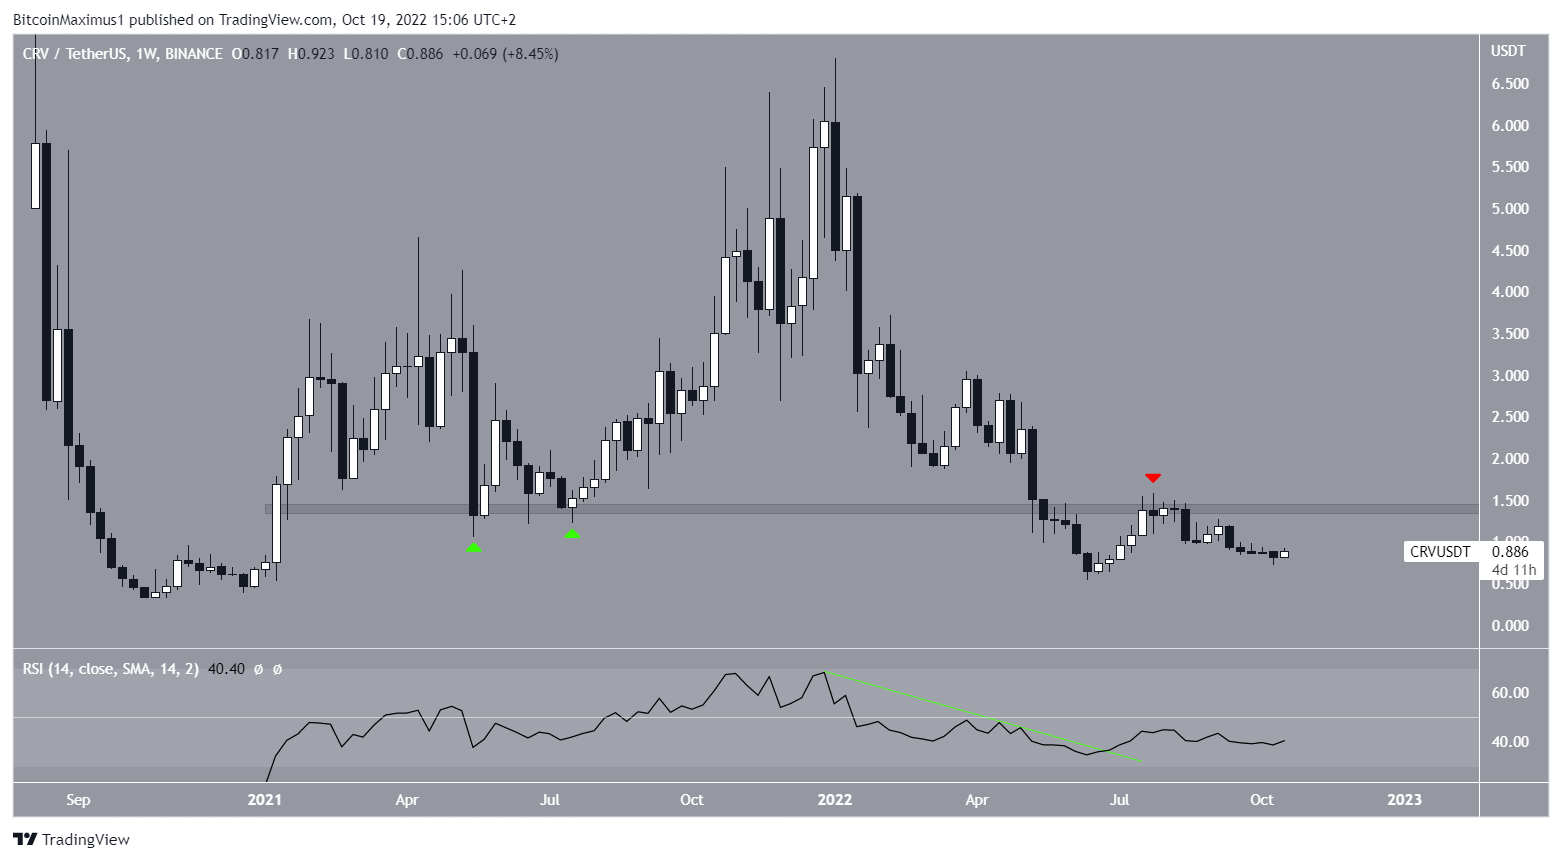
While a breakout from the wedge is likely, the direction of the long-term trend is still undetermined, due to mixed technical analysis readings from the weekly timeframe.
There is a crucial resistance area at $1.40, a level that had previously acted as support. Until there is a weekly close above this level, the long-term trend cannot be considered bullish.
Additionally, while the weekly RSI has broken out from a descending resistance line, it is still trading below 50.
So, a weekly close above the $1.40 area and a weekly RSI movement above 50 is required in order for the CRV price prediction to be confirmed as bullish.
Conversely, a drop below $0.72 would indicate that the trend is bearish instead.
For the latest BeInCrypto Bitcoin (BTC) and crypto market analysis, click here
Disclaimer: BeInCrypto strives to provide accurate and up-to-date information, but it will not be responsible for any missing facts or inaccurate information. You comply and understand that you should use any of this information at your own risk. Cryptocurrencies are highly volatile financial assets, so research and make your own financial decisions.
Disclaimer
All the information contained on our website is published in good faith and for general information purposes only. Any action the reader takes upon the information found on our website is strictly at their own risk.
Leave a Reply