

Bitcoin (BTC) price has kept investors waiting for a significant move, but chances are that a slow and steady price consolidation could continue to keep the market waiting.
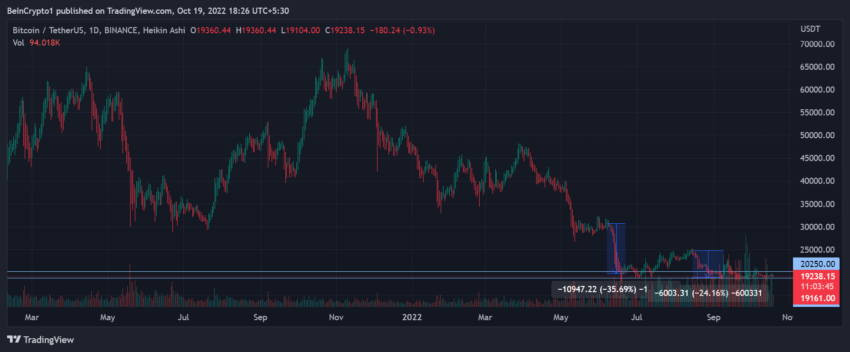
Bitcoin price has maintained a larger downtrend for most of this year. As the BTC price has traded below the $20,000 mark for over two weeks, market participants are on the lookout for signs of a breakout.
With no major catalysts for a breakout in sight, many in the market ponder on the idea of whether the $19,000 range is the market bottom.
Bitcoin (BTC) price’s larger picture
After the June 2022 drawdown that brought Bitcoin price down by over 35%, BTC’s price has maintained a rangebound momentum. In August-mid, Bitcoin price made a local high of around $25,000, but since bulls couldn’t hold the price above that level, another pullback of around 25% followed over the next few weeks.
After almost four months of stagnant price action, it makes sense to look at BTC’s long-term trend to better understand when Bitcoin price could actually bottom.
Data from Santiment presented that the Mean Dollar Invested Age (MDIA) is at an all-time high, meaning there’s no distribution of coins happening for a long time. On the other hand, the MVRV (3-year) trend for the last one and a half years closely resembles the 2017-2019 situation.
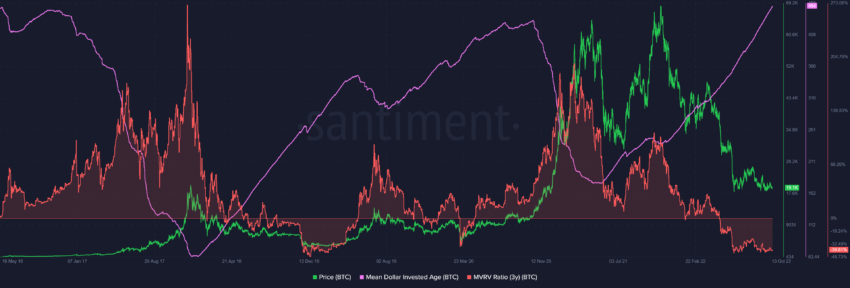
It is worth noting that in 2018-end when MVRV had a similar pattern price bottomed out around the same level.
Furthermore, the social volume has declined significantly since the market top, and sentiment has been making much more lows than highs simultaneously.
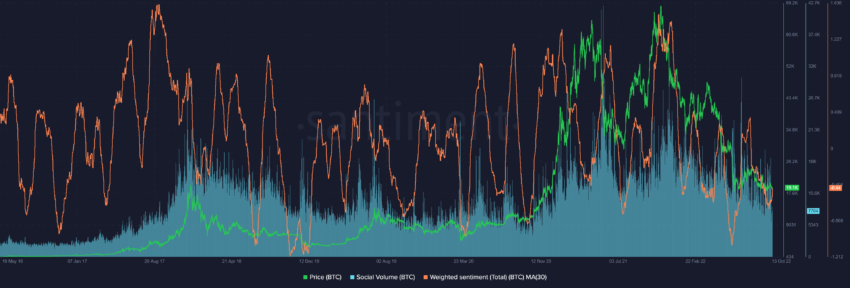
Usually, when the sentiment is negative, the price tends to pick up, doing the opposite of the herd.
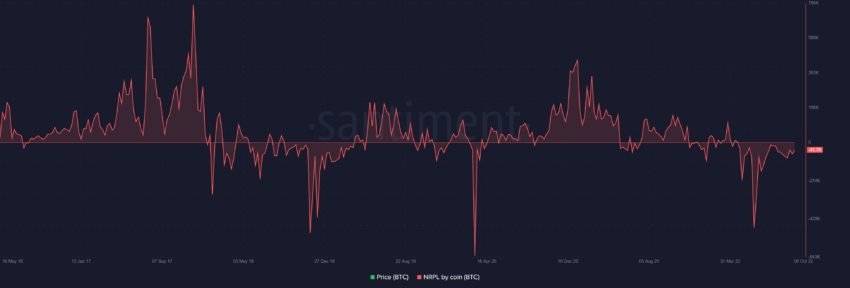
Market participants are Rekt
Bitcoin’s network-realized-profit-loss shows that in BTC, participants have experienced losses at the same level as in 2019, however, in USD terms, losses are much higher as the price of BTC has grown almost 10x since then. NPRL is a good indicator that tells how rekt the market participants are.
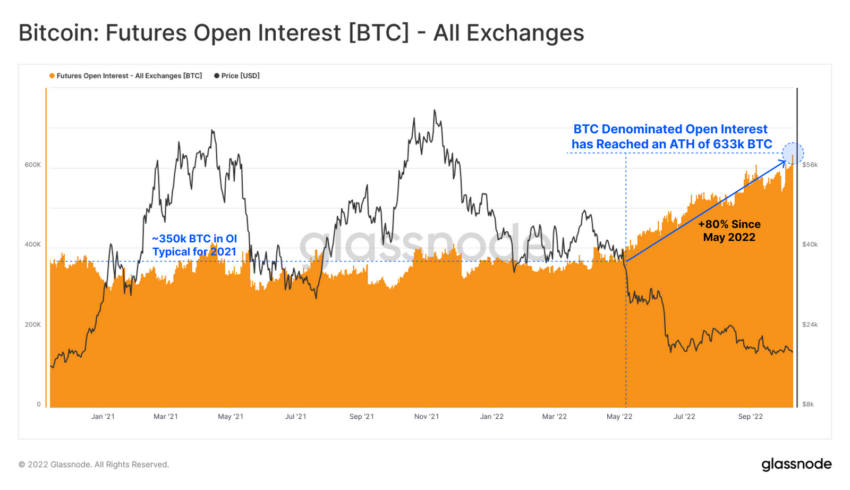
Furthermore, Glassnode data highlighted that the Bitcoin price could be primed for a burst of volatility, with both realized and options implied volatility falling to historic lows. Interestingly, futures open interest has hit all-time highs, despite liquidations being at all-time lows.
Thus, looking at the long-term data current situation can give some hope to Bitcoin HODLers; however, history does not always repeat itself. In case of a bearish outcome, the BTC price could circle back to $16,000 and then the $14,000 price level.
Disclaimer: BeinCrypto strives to provide accurate and up-to-date information, but it will not be responsible for any missing facts or inaccurate information. You comply and understand that you should use any of this information at your own risk. Cryptocurrencies are highly volatile financial assets, so research and make your own financial decisions.
For Be[In]Crypto’s latest Bitcoin (BTC) analysis, click here
Disclaimer
All the information contained on our website is published in good faith and for general information purposes only. Any action the reader takes upon the information found on our website is strictly at their own risk.
Leave a Reply